Regions Bank 2010 Annual Report Download - page 83
Download and view the complete annual report
Please find page 83 of the 2010 Regions Bank annual report below. You can navigate through the pages in the report by either clicking on the pages listed below, or by using the keyword search tool below to find specific information within the annual report.-
 1
1 -
2
-
3
-
4
-
5
-
6
-
7
-
8
-
9
-
10
-
11
-
12
-
13
-
14
-
15
-
16
-
17
-
18
-
19
-
20
-
21
-
22
-
23
-
24
-
25
-
26
-
27
-
28
-
29
-
30
-
31
-
32
-
33
-
34
-
35
-
36
-
37
-
38
-
39
-
40
-
41
-
42
-
43
-
44
-
45
-
46
-
47
-
48
-
49
-
50
-
51
-
52
-
53
-
54
-
55
-
56
-
57
-
58
-
59
-
60
-
61
-
62
-
63
-
64
-
65
-
66
-
67
-
68
-
69
-
70
-
71
-
72
-
 73
73 -
 74
74 -
 75
75 -
 76
76 -
 77
77 -
 78
78 -
 79
79 -
 80
80 -
 81
81 -
 82
82 -
 83
83 -
 84
84 -
 85
85 -
 86
86 -
 87
87 -
 88
88 -
 89
89 -
 90
90 -
 91
91 -
 92
92 -
 93
93 -
94
-
95
-
96
-
97
-
98
-
99
-
100
-
101
-
102
-
103
-
104
-
105
-
106
-
107
-
108
-
109
-
110
-
111
-
112
-
113
-
114
-
115
-
116
-
117
-
118
-
119
-
120
-
121
-
122
-
123
-
124
-
125
-
126
-
127
-
128
-
129
-
130
-
131
-
132
-
133
-
134
-
135
-
136
-
137
-
138
-
139
-
140
-
141
-
142
-
143
-
144
-
145
-
146
-
147
-
148
-
149
-
150
-
151
-
152
-
153
-
154
-
155
-
156
-
157
-
158
-
159
-
160
-
161
-
162
-
163
-
164
-
165
-
166
-
167
-
168
-
169
-
170
-
171
-
172
-
173
-
174
-
175
-
176
-
177
-
178
-
179
-
180
-
181
-
182
-
183
-
184
-
185
-
186
-
187
-
188
-
189
-
190
-
191
-
192
-
193
-
194
-
195
-
196
-
197
-
198
-
199
-
200
-
201
-
202
-
203
-
204
-
205
-
206
-
207
-
208
-
209
-
210
-
211
-
212
-
213
-
214
-
215
-
216
-
217
-
218
-
219
-
220
-
221
-
222
-
223
-
224
-
225
-
226
-
227
-
228
-
229
-
230
-
231
-
232
-
233
-
234
-
235
-
236
 |
 |
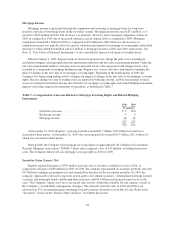
against Morgan Keegan, Morgan Asset Management and certain of their employees for violations of federal and
state securities laws and NASD rules relating to certain funds previously administered by Morgan Keegan and
Morgan Asset Management. Based on the status of settlement negotiations, Regions believed that a loss on the
matter was probable and reasonably estimable. Accordingly, at June 30, 2010, Morgan Keegan recorded a
non-tax deductible $200 million charge representing the estimate of probable loss. Settlement negotiations and
trial preparations are ongoing. Refer to Note 23 “Commitments, Contingencies and Guarantees” to the
consolidated financial statements for additional information.
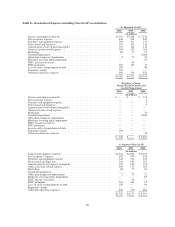
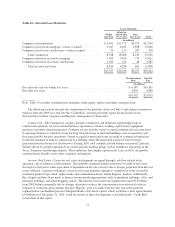
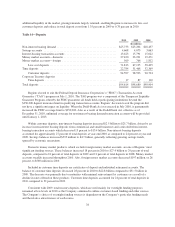
Other Miscellaneous Expenses
Other miscellaneous expenses include communications, postage, supplies, credit-related costs and business
development services. Other miscellaneous expenses decreased $38 million to $698 million in 2010. The decline
in 2010 was driven by various categories, including those listed above.
INCOME TAXES
The Company’s income tax benefit for 2010 was $346 million compared to a tax benefit of $171 million in
2009, resulting in an effective tax rate of 39.1 percent and 14.2 percent, respectively. The increase in income tax
benefit reflects the impact of the decline in the number and amount of leveraged lease terminations offset by the
recognition of the nondeductible regulatory charge and the decrease in the consolidated pre-tax loss.
The Company’s effective tax rate is affected by recurring items such as affordable housing tax credits, bank-
owned life insurance and tax-exempt income, which are expected to be consistent in the near term. The effective
tax rate is also affected by one-time items that may occur in any given period but are not consistent from period
to period, such as the termination of certain leveraged leases and expenses that are nondeductible for income tax
purposes. Accordingly, future period effective tax rates may not be comparable to the current period.
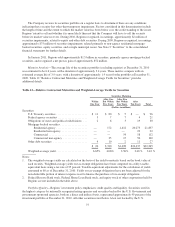
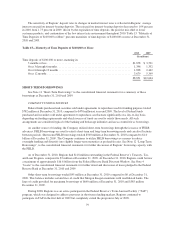
At December 31, 2010, the Company reported a net deferred tax asset of $1.4 billion. Of this amount, $960
million was generated from differences between the financial statement carrying amounts and the corresponding
tax bases of assets and liabilities, of which a significant portion relates to the allowance for loan losses. These net
deferred tax assets have not yet reduced taxable income and therefore, do not have a set expiration date. The
remaining $427 million net deferred tax asset balance relates to tax carryforwards that have defined expiration
dates which are typically 15 or 20 years from the date of creation. Of the $427 million, $92 million of this
deferred tax asset is related to tax carryforwards that have expiration dates prior to the tax year 2023, and a
valuation allowance of $14 million exists against these amounts.
Management’s determination of the realization of the net deferred tax asset is based upon an evaluation of
the four possible sources of taxable income: 1) the future reversals of taxable temporary differences; 2) future
taxable income exclusive of reversing temporary differences and carryforwards; 3) taxable income in prior
carryback years; and 4) tax-planning strategies. In making a conclusion, management has evaluated all available
positive and negative evidence impacting these sources of taxable income. The primary sources of positive and
negative evidence impacting taxable income are summarized below.
Positive Evidence
• History of earnings—The Company has a strong history of generating earnings and has demonstrated
positive earnings in 17 of the last 20 years with the prior three years’ results of operations being
impacted by unprecedented credit losses. Absent the $6.0 billion goodwill impairment charge during
2008, which had no impact on taxable net income reported on the Company’s tax returns, the Company
would have generated positive earnings during that year leaving only 2009 and 2010 in loss positions.
The Company did not generate any federal net operating losses or tax credit carryforwards until 2009,
thus there is no history of significant tax carryforwards expiring unused.
69