Regions Bank 2010 Annual Report Download - page 135
Download and view the complete annual report
Please find page 135 of the 2010 Regions Bank annual report below. You can navigate through the pages in the report by either clicking on the pages listed below, or by using the keyword search tool below to find specific information within the annual report.-
 1
1 -
2
-
3
-
4
-
5
-
6
-
7
-
8
-
9
-
10
-
11
-
12
-
13
-
14
-
15
-
16
-
17
-
18
-
19
-
20
-
21
-
22
-
23
-
24
-
25
-
26
-
27
-
28
-
29
-
30
-
31
-
32
-
33
-
34
-
35
-
36
-
37
-
38
-
39
-
40
-
41
-
42
-
43
-
44
-
45
-
46
-
47
-
48
-
49
-
50
-
51
-
52
-
53
-
54
-
55
-
56
-
57
-
58
-
59
-
60
-
61
-
62
-
63
-
64
-
65
-
66
-
67
-
68
-
69
-
70
-
71
-
72
-
73
-
74
-
75
-
76
-
77
-
78
-
79
-
80
-
81
-
82
-
83
-
84
-
85
-
86
-
87
-
88
-
89
-
90
-
91
-
92
-
93
-
94
-
95
-
96
-
97
-
98
-
99
-
100
-
101
-
102
-
103
-
104
-
105
-
106
-
107
-
108
-
109
-
110
-
111
-
112
-
113
-
114
-
115
-
116
-
117
-
118
-
119
-
120
-
121
-
122
-
123
-
124
-
 125
125 -
 126
126 -
 127
127 -
 128
128 -
 129
129 -
 130
130 -
 131
131 -
 132
132 -
 133
133 -
 134
134 -
 135
135 -
 136
136 -
 137
137 -
 138
138 -
 139
139 -
 140
140 -
 141
141 -
 142
142 -
 143
143 -
 144
144 -
 145
145 -
146
-
147
-
148
-
149
-
150
-
151
-
152
-
153
-
154
-
155
-
156
-
157
-
158
-
159
-
160
-
161
-
162
-
163
-
164
-
165
-
166
-
167
-
168
-
169
-
170
-
171
-
172
-
173
-
174
-
175
-
176
-
177
-
178
-
179
-
180
-
181
-
182
-
183
-
184
-
185
-
186
-
187
-
188
-
189
-
190
-
191
-
192
-
193
-
194
-
195
-
196
-
197
-
198
-
199
-
200
-
201
-
202
-
203
-
204
-
205
-
206
-
207
-
208
-
209
-
210
-
211
-
212
-
213
-
214
-
215
-
216
-
217
-
218
-
219
-
220
-
221
-
222
-
223
-
224
-
225
-
226
-
227
-
228
-
229
-
230
-
231
-
232
-
233
-
234
-
235
-
236
 |
 |

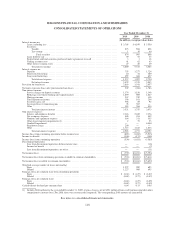
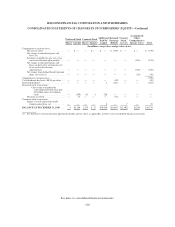
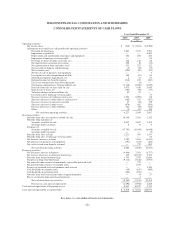
REGIONS FINANCIAL CORPORATION AND SUBSIDIARIES
CONSOLIDATED STATEMENTS OF CASH FLOWS
Year Ended December 31
2010 2009 2008
(In millions)
Operating activities:
Net income (loss) ................................................................. $ (539) $ (1,031) $ (5,596)
Adjustments to reconcile net cash provided by operating activities:
Provision for loan losses ....................................................... 2,863 3,541 2,057
Impairment of goodwill ........................................................ — — 6,000
Depreciation and amortization of premises and equipment ............................. 284 284 286
Impairment of mortgage servicing rights .......................................... — — 85
Provision for losses on other real estate, net ........................................ 168 142 88
Net amortization (accretion) of securities .......................................... 220 10 (15)
Net amortization of loans and other assets ......................................... 233 252 122
Net accretion of deposits and borrowings .......................................... (5) (19) (15)
Net securities gains ........................................................... (394) (69) (92)
Net loss on sale of premises and equipment ........................................ — — 3
Loss (gain) on early extinguishment of debt ........................................ 108 (61) 66
Other-than-temporary impairments, net ........................................... 2 75 23
Deferred income tax (benefit) expense ............................................ (210) 245 (407)
Excess tax benefits from share-based payments ..................................... — (4) —
Originations and purchases of loans held for sale .................................... (5,148) (7,409) (3,079)
Proceeds from sales of loans held for sale .......................................... 5,875 7,650 3,849
Gain on sale of loans, net ....................................................... (107) (96) (57)
Valuation charges on loans held for sale ........................................... 45 25 —
Loss from sale of mortgage servicing rights ........................................ — — 15
Decrease (increase) in trading account assets ....................................... 1,923 (1,989) 88
(Increase) decrease in other interest-earning assets ................................... (485) 163 (392)
Decrease (increase) in interest receivable .......................................... 47 (10) 158
(Increase) decrease in other assets ................................................ (876) 462 (584)
Increase (decrease) in other liabilities ............................................. 224 (90) (764)
Other ...................................................................... (1) (52) 168
Net cash from operating activities ............................................ 4,227 2,019 2,007
Investing activities:
Proceeds from sales of securities available for sale ....................................... 10,340 5,451 2,142
Proceeds from maturities of:
Securities available for sale ..................................................... 8,012 5,405 3,181
Securities held to maturity ...................................................... 6 17 9
Purchases of:
Securities available for sale ..................................................... (17,701) (15,646) (6,848)
Securities held to maturity ...................................................... — — (5)
Proceeds from sales of loans ........................................................ 2,233 645 1,247
Proceeds from sales of mortgage servicing rights ........................................ — — 44
Net decrease (increase) in loans ..................................................... 1,385 2,443 (6,433)
Net purchases of premises and equipment .............................................. (191) (234) (464)
Net cash received from deposits assumed .............................................. — 279 894
Net cash from investing activities ................................................ 4,084 (1,640) (6,233)
Financing activities:
Net (decrease) increase in deposits ................................................... (4,066) 7,501 (4,757)
Net increase (decrease) in short-term borrowings ........................................ 269 (12,154) 4,702
Proceeds from long-term borrowings ................................................. 3,743 2,792 11,606
Payments on long-term borrowings ................................................... (9,116) (3,246) (3,955)
Net proceeds from issuance of mandatorily convertible preferred stock ...................... — 278 —
Net proceeds from issuance of common stock .......................................... — 1,769 —
Issuance of preferred stock and common stock warrant ................................... — — 3,500
Cash dividends on common stock .................................................... (49) (105) (669)
Cash dividends on preferred stock .................................................... (184) (194) —
Proceeds from stock transactions under compensation plans ............................... — 14 27
Excess tax benefits from share-based payments ......................................... — 4 —
Net cash from financing activities ................................................ (9,403) (3,341) 10,454
Decrease in cash and cash equivalents ............................................ (1,092) (2,962) 6,228
Cash and cash equivalents at beginning of year ............................................. 8,011 10,973 4,745
Cash and cash equivalents at end of period ................................................. $ 6,919 $ 8,011 $10,973
See notes to consolidated financial statements.
121