Regions Bank 2010 Annual Report Download - page 106
Download and view the complete annual report
Please find page 106 of the 2010 Regions Bank annual report below. You can navigate through the pages in the report by either clicking on the pages listed below, or by using the keyword search tool below to find specific information within the annual report.-
 1
1 -
2
-
3
-
4
-
5
-
6
-
7
-
8
-
9
-
10
-
11
-
12
-
13
-
14
-
15
-
16
-
17
-
18
-
19
-
20
-
21
-
22
-
23
-
24
-
25
-
26
-
27
-
28
-
29
-
30
-
31
-
32
-
33
-
34
-
35
-
36
-
37
-
38
-
39
-
40
-
41
-
42
-
43
-
44
-
45
-
46
-
47
-
48
-
49
-
50
-
51
-
52
-
53
-
54
-
55
-
56
-
57
-
58
-
59
-
60
-
61
-
62
-
63
-
64
-
65
-
66
-
67
-
68
-
69
-
70
-
71
-
72
-
73
-
74
-
75
-
76
-
77
-
78
-
79
-
80
-
81
-
82
-
83
-
84
-
85
-
86
-
87
-
88
-
89
-
90
-
91
-
92
-
93
-
94
-
95
-
 96
96 -
 97
97 -
 98
98 -
 99
99 -
 100
100 -
 101
101 -
 102
102 -
 103
103 -
 104
104 -
 105
105 -
 106
106 -
 107
107 -
 108
108 -
 109
109 -
 110
110 -
 111
111 -
 112
112 -
 113
113 -
 114
114 -
 115
115 -
 116
116 -
117
-
118
-
119
-
120
-
121
-
122
-
123
-
124
-
125
-
126
-
127
-
128
-
129
-
130
-
131
-
132
-
133
-
134
-
135
-
136
-
137
-
138
-
139
-
140
-
141
-
142
-
143
-
144
-
145
-
146
-
147
-
148
-
149
-
150
-
151
-
152
-
153
-
154
-
155
-
156
-
157
-
158
-
159
-
160
-
161
-
162
-
163
-
164
-
165
-
166
-
167
-
168
-
169
-
170
-
171
-
172
-
173
-
174
-
175
-
176
-
177
-
178
-
179
-
180
-
181
-
182
-
183
-
184
-
185
-
186
-
187
-
188
-
189
-
190
-
191
-
192
-
193
-
194
-
195
-
196
-
197
-
198
-
199
-
200
-
201
-
202
-
203
-
204
-
205
-
206
-
207
-
208
-
209
-
210
-
211
-
212
-
213
-
214
-
215
-
216
-
217
-
218
-
219
-
220
-
221
-
222
-
223
-
224
-
225
-
226
-
227
-
228
-
229
-
230
-
231
-
232
-
233
-
234
-
235
-
236
 |
 |
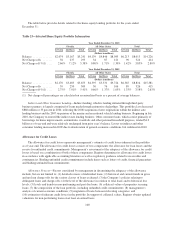
Interest rate risk at Morgan Keegan arises from the exposure of holding interest-sensitive financial
instruments such as government, corporate and municipal bonds, and certain preferred equities. Morgan Keegan
manages its exposure to interest rate risk by setting and monitoring limits and, where feasible, entering into
offsetting positions in securities with similar interest rate risk characteristics. Securities inventories recorded in
trading account assets on the consolidated balance sheets, are marked to market, and, accordingly, there are no
unrecorded gains or losses in value. While a significant portion of the securities inventories have contractual
maturities in excess of five years, these inventories, on average, turn over in excess of twelve times per year.
Accordingly, the exposure to interest rate risk inherent in Morgan Keegan’s securities inventories is less than that
of similar financial instruments held by firms in other industries. Morgan Keegan’s equity securities inventories
are exposed to risk of loss in the event of unfavorable price movements. Also, Morgan Keegan is subject to credit
risk arising from non-performance by trading counterparties, customers and issuers of debt securities owned.
This risk is managed by imposing and monitoring position limits, monitoring trading counterparties, reviewing
security concentrations, holding and marking to market collateral, and conducting business through clearing
organizations that guarantee performance. Morgan Keegan regularly participates in the trading of some
derivative securities for its customers; however, this activity does not involve Morgan Keegan acquiring a
significant position or commitment in these products and this trading is not a significant portion of Morgan
Keegan’s business.
Morgan Keegan has been an underwriter and dealer in auction rate securities. See Note 23 “Commitments,
Contingencies and Guarantees” to the consolidated financial statements for more details regarding regulatory
action related to Morgan Keegan auction rate securities. As of December 31, 2010, customers of Morgan Keegan
owned approximately $54 million of auction rate securities, and Morgan Keegan held approximately $161
million of auction rate securities on the balance sheet.
To manage trading risks arising from interest rate and equity price risks, Regions uses a Value at Risk
(“VAR”) model along with other risk management methods to measure the potential fair value the Company
could lose on its trading positions given a specified statistical confidence level and time-to-liquidate time
horizon. The end-of-period VAR was approximately $805 thousand at December 31, 2010 and $1 million at
December 31, 2009. Maximum daily VAR utilization during 2010 was $2 million and average daily VAR during
the same period was $3 million.
LIQUIDITY RISK
Liquidity is an important factor in the financial condition of Regions and affects Regions’ ability to meet the
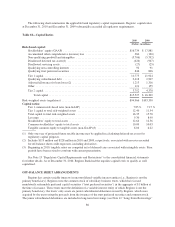
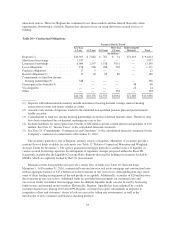
borrowing needs and deposit withdrawal requirements of its customers. Table 20 “Contractual Obligations”
summarizes Regions’ contractual cash obligations at December 31, 2010. Regions intends to fund obligations
primarily through cash generated from normal operations. In addition to these obligations, Regions has
obligations related to potential litigation contingencies (see Note 23 “Commitments, Contingencies and
Guarantees” to the consolidated financial statements for additional discussion of the Company’s funding
requirements).
Assets, consisting principally of loans and securities, are funded by customer deposits, purchased funds,
borrowed funds and stockholders’ equity. Regions’ goal in liquidity management is to satisfy the cash flow
requirements of depositors and borrowers, while at the same time meeting its cash flow needs. The challenges of
the current market environment demonstrate the importance of having and using diversified sources of liquidity
to satisfy the Company’s funding requirements.
In order to ensure an appropriate level of liquidity is maintained, Regions performs specific procedures
including scenario analyses and stress testing at the bank, holding company and affiliate levels. Regions’ policy
is to maintain a sufficient level of funding to meet projected cash needs, including all debt service, dividends, and
maturities, for the subsequent two years at the parent company and acceptable periods for the bank and other
affiliates. The Company’s funding and contingency planning does not currently include any reliance on
92