Regions Bank 2010 Annual Report Download - page 165
Download and view the complete annual report
Please find page 165 of the 2010 Regions Bank annual report below. You can navigate through the pages in the report by either clicking on the pages listed below, or by using the keyword search tool below to find specific information within the annual report.-
 1
1 -
2
-
3
-
4
-
5
-
6
-
7
-
8
-
9
-
10
-
11
-
12
-
13
-
14
-
15
-
16
-
17
-
18
-
19
-
20
-
21
-
22
-
23
-
24
-
25
-
26
-
27
-
28
-
29
-
30
-
31
-
32
-
33
-
34
-
35
-
36
-
37
-
38
-
39
-
40
-
41
-
42
-
43
-
44
-
45
-
46
-
47
-
48
-
49
-
50
-
51
-
52
-
53
-
54
-
55
-
56
-
57
-
58
-
59
-
60
-
61
-
62
-
63
-
64
-
65
-
66
-
67
-
68
-
69
-
70
-
71
-
72
-
73
-
74
-
75
-
76
-
77
-
78
-
79
-
80
-
81
-
82
-
83
-
84
-
85
-
86
-
87
-
88
-
89
-
90
-
91
-
92
-
93
-
94
-
95
-
96
-
97
-
98
-
99
-
100
-
101
-
102
-
103
-
104
-
105
-
106
-
107
-
108
-
109
-
110
-
111
-
112
-
113
-
114
-
115
-
116
-
117
-
118
-
119
-
120
-
121
-
122
-
123
-
124
-
125
-
126
-
127
-
128
-
129
-
130
-
131
-
132
-
133
-
134
-
135
-
136
-
137
-
138
-
139
-
140
-
141
-
142
-
143
-
144
-
145
-
146
-
147
-
148
-
149
-
150
-
151
-
152
-
153
-
154
-
 155
155 -
 156
156 -
 157
157 -
 158
158 -
 159
159 -
 160
160 -
 161
161 -
 162
162 -
 163
163 -
 164
164 -
 165
165 -
 166
166 -
 167
167 -
 168
168 -
 169
169 -
 170
170 -
 171
171 -
 172
172 -
 173
173 -
 174
174 -
 175
175 -
176
-
177
-
178
-
179
-
180
-
181
-
182
-
183
-
184
-
185
-
186
-
187
-
188
-
189
-
190
-
191
-
192
-
193
-
194
-
195
-
196
-
197
-
198
-
199
-
200
-
201
-
202
-
203
-
204
-
205
-
206
-
207
-
208
-
209
-
210
-
211
-
212
-
213
-
214
-
215
-
216
-
217
-
218
-
219
-
220
-
221
-
222
-
223
-
224
-
225
-
226
-
227
-
228
-
229
-
230
-
231
-
232
-
233
-
234
-
235
-
236
 |
 |

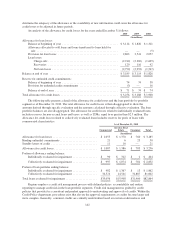
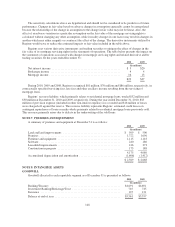
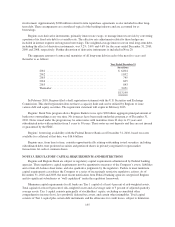
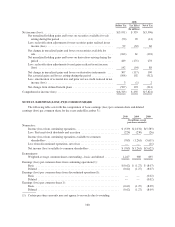
These other intangible assets resulted from customer relationships and employment agreements related to
various acquisitions and are being amortized primarily on an accelerated basis over a period ranging from two to
twelve years. In 2010 and 2009, Regions’ amortization of other intangibles was $12.8 million and $15.6 million,
respectively. Regions noted no indicators of impairment for all other identifiable intangible assets.
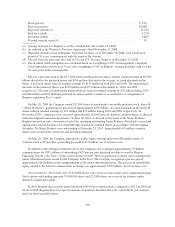
The aggregate amount of amortization expense for core deposit intangible assets and other intangible assets
is estimated as follows:
Year Ended December 31
(In millions)
2011 .......................................... $105
2012 .......................................... 88
2013 .......................................... 74
2014 .......................................... 61
2015 .......................................... 45
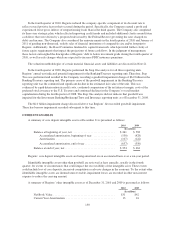
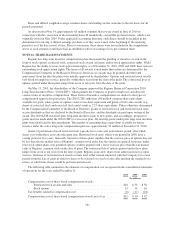
NOTE 9. FORECLOSED PROPERTIES
Other real estate and certain other assets acquired in foreclosure are carried at the lower of the recorded
investment in the loan or fair value less estimated costs to sell the property.
An analysis of foreclosed properties for the years ended December 31 follows:
2010 2009
(In millions)
Balance at beginning of year .................................... $607 $243
Transfer from loans ....................................... 649 890
Foreclosed property sold ................................... (565) (361)
Writedowns and partial liquidations ........................... (237) (165)
(153) 364
Balance at end of year ......................................... $454 $607
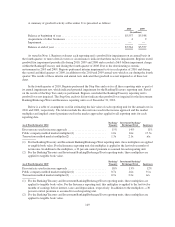
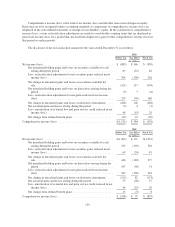
NOTE 10. DEPOSITS
The following schedule presents a detail of interest-bearing deposits at December 31:
2010 2009
(In millions)
Savings accounts .......................................... $ 4,668 $ 4,073
Interest-bearing transaction accounts .......................... 13,423 15,791
Money market accounts .................................... 27,420 23,291
Money market accounts—foreign ............................. 569 766
Time deposits ............................................ 22,784 31,468
Customer deposits ..................................... 68,864 75,389
Treasury time deposits ..................................... 17 87
$68,881 $75,476
The aggregate amount of time deposits of $100,000 or more, including certificates of deposit of $100,000 or
more, was $8.9 billion and $12.6 billion at December 31, 2010 and 2009, respectively.
151