Regions Bank 2010 Annual Report Download - page 156
Download and view the complete annual report
Please find page 156 of the 2010 Regions Bank annual report below. You can navigate through the pages in the report by either clicking on the pages listed below, or by using the keyword search tool below to find specific information within the annual report.-
 1
1 -
2
-
3
-
4
-
5
-
6
-
7
-
8
-
9
-
10
-
11
-
12
-
13
-
14
-
15
-
16
-
17
-
18
-
19
-
20
-
21
-
22
-
23
-
24
-
25
-
26
-
27
-
28
-
29
-
30
-
31
-
32
-
33
-
34
-
35
-
36
-
37
-
38
-
39
-
40
-
41
-
42
-
43
-
44
-
45
-
46
-
47
-
48
-
49
-
50
-
51
-
52
-
53
-
54
-
55
-
56
-
57
-
58
-
59
-
60
-
61
-
62
-
63
-
64
-
65
-
66
-
67
-
68
-
69
-
70
-
71
-
72
-
73
-
74
-
75
-
76
-
77
-
78
-
79
-
80
-
81
-
82
-
83
-
84
-
85
-
86
-
87
-
88
-
89
-
90
-
91
-
92
-
93
-
94
-
95
-
96
-
97
-
98
-
99
-
100
-
101
-
102
-
103
-
104
-
105
-
106
-
107
-
108
-
109
-
110
-
111
-
112
-
113
-
114
-
115
-
116
-
117
-
118
-
119
-
120
-
121
-
122
-
123
-
124
-
125
-
126
-
127
-
128
-
129
-
130
-
131
-
132
-
133
-
134
-
135
-
136
-
137
-
138
-
139
-
140
-
141
-
142
-
143
-
144
-
145
-
 146
146 -
 147
147 -
 148
148 -
 149
149 -
 150
150 -
 151
151 -
 152
152 -
 153
153 -
 154
154 -
 155
155 -
 156
156 -
 157
157 -
 158
158 -
 159
159 -
 160
160 -
 161
161 -
 162
162 -
 163
163 -
 164
164 -
 165
165 -
 166
166 -
167
-
168
-
169
-
170
-
171
-
172
-
173
-
174
-
175
-
176
-
177
-
178
-
179
-
180
-
181
-
182
-
183
-
184
-
185
-
186
-
187
-
188
-
189
-
190
-
191
-
192
-
193
-
194
-
195
-
196
-
197
-
198
-
199
-
200
-
201
-
202
-
203
-
204
-
205
-
206
-
207
-
208
-
209
-
210
-
211
-
212
-
213
-
214
-
215
-
216
-
217
-
218
-
219
-
220
-
221
-
222
-
223
-
224
-
225
-
226
-
227
-
228
-
229
-
230
-
231
-
232
-
233
-
234
-
235
-
236
 |
 |

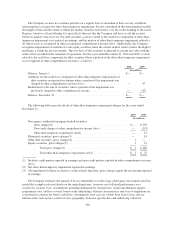
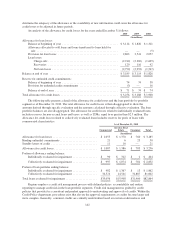
determine the adequacy of the allowance or the availability of new information could cause the allowance for
credit losses to be adjusted in future periods.
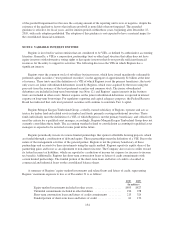
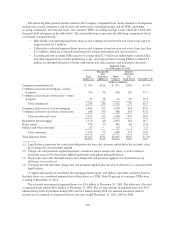
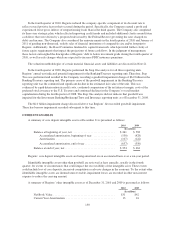
An analysis of the allowance for credit losses for the years ended December 31 follows:
2010 2009 2008
(In millions)
Allowance for loan losses:
Balance at beginning of year ....................................... $3,114 $ 1,826 $ 1,321
Allowance allocated to sold loans and loans transferred to loans held for
sale ......................................................... — — (5)
Provision for loan losses .......................................... 2,863 3,541 2,057
Loan losses:
Charge-offs ................................................. (2,912) (2,369) (1,639)
Recoveries ................................................. 120 116 92
Net loan losses .............................................. (2,792) (2,253) (1,547)
Balance at end of year ................................................ $3,185 $ 3,114 $ 1,826
Reserve for unfunded credit commitments:
Balance at beginning of year ....................................... 74 74 58
Provision for unfunded credit commitments ........................... (3) — 16
Balance at end of year ............................................ $ 71 $ 74 $ 74
Total allowance for credit losses ........................................ $3,256 $ 3,188 $ 1,900
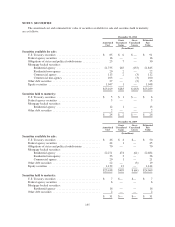
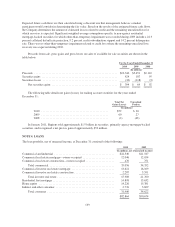
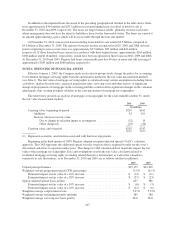
The following table presents a detail of the allowance for credit losses and the loan portfolio by portfolio
segment as of December 31, 2010. The total allowance for credit losses is then disaggregated to show the
amounts derived through specific evaluation and the amounts calculated through collective evaluation. The loan
portfolio balances are also disaggregated. The allowance for credit losses related to individually evaluated loans
includes reserves for non-accrual loans and leases, as well as TDRs, equal to or greater than $2.5 million. The
allowance for credit losses related to collectively evaluated loans includes reserves for pools of loans with
common risk characteristics.
As of December 31, 2010
Commercial
Investor Real
Estate Consumer Total
(In millions)
Allowance for loan losses ............................... $ 1,055 $ 1,370 $ 760 $ 3,185
Binding unfunded commitments .......................... 21 6 23 50
Standby letters of credit ................................ 11 10 — 21
Allowance for credit losses .............................. $ 1,087 $ 1,386 $ 783 $ 3,256
Portion of allowance ending balance:
Individually evaluated for impairment ................. $ 90 $ 312 $ 2 $ 404
Collectively evaluated for impairment ................. $ 997 $ 1,074 $ 781 $ 2,852
Portion of loan portfolio ending balance:
Individually evaluated for impairment ................. $ 482 $ 1,367 $ 13 $ 1,862
Collectively evaluated for impairment ................. 34,574 14,541 31,887 81,002
Total loans evaluated for impairment ...................... $35,056 $15,908 $31,900 $82,864
Regions employs a credit risk management process with defined policies, accountability and routine
reporting to manage credit risk in the loan portfolio segments. Credit risk management is guided by credit
policies that provide for a consistent and prudent approach to underwriting and approvals of credits. Within the
Credit Policy department, procedures exist that elevate the approval requirements as credits become larger and
more complex. Generally, consumer credits are centrally underwritten based on custom credit matrices and
142