Regions Bank 2010 Annual Report Download - page 70
Download and view the complete annual report
Please find page 70 of the 2010 Regions Bank annual report below. You can navigate through the pages in the report by either clicking on the pages listed below, or by using the keyword search tool below to find specific information within the annual report.-
 1
1 -
2
-
3
-
4
-
5
-
6
-
7
-
8
-
9
-
10
-
11
-
12
-
13
-
14
-
15
-
16
-
17
-
18
-
19
-
20
-
21
-
22
-
23
-
24
-
25
-
26
-
27
-
28
-
29
-
30
-
31
-
32
-
33
-
34
-
35
-
36
-
37
-
38
-
39
-
40
-
41
-
42
-
43
-
44
-
45
-
46
-
47
-
48
-
49
-
50
-
51
-
52
-
53
-
54
-
55
-
56
-
57
-
58
-
59
-
 60
60 -
 61
61 -
 62
62 -
 63
63 -
 64
64 -
 65
65 -
 66
66 -
 67
67 -
 68
68 -
 69
69 -
 70
70 -
 71
71 -
 72
72 -
 73
73 -
 74
74 -
 75
75 -
 76
76 -
 77
77 -
 78
78 -
 79
79 -
 80
80 -
81
-
82
-
83
-
84
-
85
-
86
-
87
-
88
-
89
-
90
-
91
-
92
-
93
-
94
-
95
-
96
-
97
-
98
-
99
-
100
-
101
-
102
-
103
-
104
-
105
-
106
-
107
-
108
-
109
-
110
-
111
-
112
-
113
-
114
-
115
-
116
-
117
-
118
-
119
-
120
-
121
-
122
-
123
-
124
-
125
-
126
-
127
-
128
-
129
-
130
-
131
-
132
-
133
-
134
-
135
-
136
-
137
-
138
-
139
-
140
-
141
-
142
-
143
-
144
-
145
-
146
-
147
-
148
-
149
-
150
-
151
-
152
-
153
-
154
-
155
-
156
-
157
-
158
-
159
-
160
-
161
-
162
-
163
-
164
-
165
-
166
-
167
-
168
-
169
-
170
-
171
-
172
-
173
-
174
-
175
-
176
-
177
-
178
-
179
-
180
-
181
-
182
-
183
-
184
-
185
-
186
-
187
-
188
-
189
-
190
-
191
-
192
-
193
-
194
-
195
-
196
-
197
-
198
-
199
-
200
-
201
-
202
-
203
-
204
-
205
-
206
-
207
-
208
-
209
-
210
-
211
-
212
-
213
-
214
-
215
-
216
-
217
-
218
-
219
-
220
-
221
-
222
-
223
-
224
-
225
-
226
-
227
-
228
-
229
-
230
-
231
-
232
-
233
-
234
-
235
-
236
 |
 |

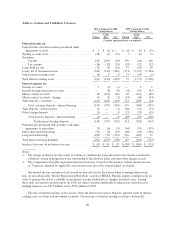
Specific factors as of the date of filing the financial statements that could negatively impact the assumptions
used in assessing goodwill for impairment include: disparities in the level of fair value changes in net assets
compared to equity; adverse business trends resulting from litigation and/or regulatory actions; increasing FDIC
premiums; higher loan losses; lengthened forecasts of unemployment in excess of 10 percent beyond 2012;
future increased minimum regulatory capital requirements above current thresholds (refer to Note 14 “Regulatory
Capital Requirements and Restrictions” to the consolidated financial statements for a discussion of current
minimum regulatory requirements); future federal rules and regulations resulting from the Dodd-Frank Act; and/
or a protraction in the current low level of interest rates beyond 2012.
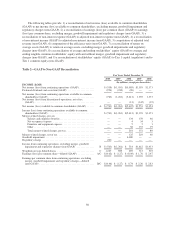
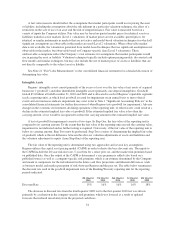
The following tables present an analysis of independent changes in market factors or significant
assumptions that could adversely impact the carrying balance of goodwill in the Banking/Treasury reporting unit
and the outcome of the Step One tests for the Investment Banking/Brokerage/Trust and Insurance reporting units:
Impact to the Carrying Value of Goodwill
Banking/Treasury Reporting Unit
Change in Discount Rate
Estimated Amount
of Impairment
(In millions)
+2%.......................................... $ (a)
+3%.......................................... (464)
+4%.......................................... (939)
Change in Tangible Book Value Multipliers (b)
-53% ......................................... $ (a)
Improvement in Loan Fair Values
+ 2.7 Percentage Points ........................... $ (a)
+ 3.0 Percentage Points ........................... (172)
+ 4.0 Percentage Points ........................... (680)
(a) Represents the point at which the implied fair value of goodwill would approximate its carrying value.
(b) Represents a 53 percent decline in both tangible book value multipliers of 1.0x and 1.3x for the public
company method and the transaction method, respectively. The 1.0x multiplier for the public company
method is before the 30 percent control premium utilized for this metric. See Note 8 for further details.
Impact to Step One Conclusion
Investment Banking/Brokerage/Trust and Insurance Reporting Units
Impact of Change
Change in Discount Rate
Investment Banking/
Brokerage/Trust Insurance
+1% ......................................... Pass Pass
+2% ......................................... Pass Pass
+3% ......................................... Fail Pass
Change in Market Approach Multipliers (c) (d)
-10%......................................... Pass Pass
-20%......................................... Pass Pass
-30%......................................... Pass Pass
-40%......................................... Fail Pass
(c) For Investment Banking/Brokerage/Trust, represents the percent decline in both tangible book value
multipliers of 1.6x and 2.1x for the public company method and the transaction method, respectively. The
1.6x multiplier for the public company method is before the 30 percent control premium utilized for this
metric. See Note 8 for further details.
(d) For Insurance, represents the percent decline in the 17.3x multiplier for the last twelve months of net income
and is before the 30 percent control premium utilized for this metric. See Note 8 for further details.
56