Regions Bank 2010 Annual Report Download - page 63
Download and view the complete annual report
Please find page 63 of the 2010 Regions Bank annual report below. You can navigate through the pages in the report by either clicking on the pages listed below, or by using the keyword search tool below to find specific information within the annual report.-
 1
1 -
2
-
3
-
4
-
5
-
6
-
7
-
8
-
9
-
10
-
11
-
12
-
13
-
14
-
15
-
16
-
17
-
18
-
19
-
20
-
21
-
22
-
23
-
24
-
25
-
26
-
27
-
28
-
29
-
30
-
31
-
32
-
33
-
34
-
35
-
36
-
37
-
38
-
39
-
40
-
41
-
42
-
43
-
44
-
45
-
46
-
47
-
48
-
49
-
50
-
51
-
52
-
 53
53 -
 54
54 -
 55
55 -
 56
56 -
 57
57 -
 58
58 -
 59
59 -
 60
60 -
 61
61 -
 62
62 -
 63
63 -
 64
64 -
 65
65 -
 66
66 -
 67
67 -
 68
68 -
 69
69 -
 70
70 -
 71
71 -
 72
72 -
 73
73 -
74
-
75
-
76
-
77
-
78
-
79
-
80
-
81
-
82
-
83
-
84
-
85
-
86
-
87
-
88
-
89
-
90
-
91
-
92
-
93
-
94
-
95
-
96
-
97
-
98
-
99
-
100
-
101
-
102
-
103
-
104
-
105
-
106
-
107
-
108
-
109
-
110
-
111
-
112
-
113
-
114
-
115
-
116
-
117
-
118
-
119
-
120
-
121
-
122
-
123
-
124
-
125
-
126
-
127
-
128
-
129
-
130
-
131
-
132
-
133
-
134
-
135
-
136
-
137
-
138
-
139
-
140
-
141
-
142
-
143
-
144
-
145
-
146
-
147
-
148
-
149
-
150
-
151
-
152
-
153
-
154
-
155
-
156
-
157
-
158
-
159
-
160
-
161
-
162
-
163
-
164
-
165
-
166
-
167
-
168
-
169
-
170
-
171
-
172
-
173
-
174
-
175
-
176
-
177
-
178
-
179
-
180
-
181
-
182
-
183
-
184
-
185
-
186
-
187
-
188
-
189
-
190
-
191
-
192
-
193
-
194
-
195
-
196
-
197
-
198
-
199
-
200
-
201
-
202
-
203
-
204
-
205
-
206
-
207
-
208
-
209
-
210
-
211
-
212
-
213
-
214
-
215
-
216
-
217
-
218
-
219
-
220
-
221
-
222
-
223
-
224
-
225
-
226
-
227
-
228
-
229
-
230
-
231
-
232
-
233
-
234
-
235
-
236
 |
 |
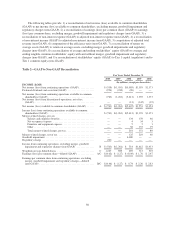
Regions believes that presenting these non-GAAP financial measures will permit investors to assess the
performance of the Company on the same basis as that applied by management and the Board of Directors. The
third quarter of 2008 was the final quarter for merger charges related to the AmSouth acquisition.
The efficiency ratio, which is a measure of productivity, is generally calculated as non-interest expense
divided by total revenue on a fully tax equivalent basis. Management uses the efficiency ratio to monitor
performance and believes this measure provides meaningful information to investors. Non-interest expense
(GAAP) is presented excluding certain adjustments to arrive at adjusted non-interest expense (non-GAAP),
which is the numerator for the efficiency ratio. Net interest income on a fully-taxable equivalent basis (GAAP)
and non-interest income (GAAP) are added together to arrive at total revenue. Adjustments are made to arrive at
adjusted total revenue (non-GAAP), which is the denominator for the efficiency ratio. Regions believes that the
exclusion of these adjustments provides a meaningful base for period-to-period comparisons, which management
believes will assist investors in analyzing the operating results of the Company and predicting future
performance. These non-GAAP financial measures are also used by management to assess the performance of
Regions’ business. It is possible that the activities related to the adjustments may recur; however, management
does not consider the activities related to the adjustments to be indications of ongoing operations. Regions
believes that presentation of these non-GAAP financial measures will permit investors to assess the performance
of the Company on the same basis as that applied by management.
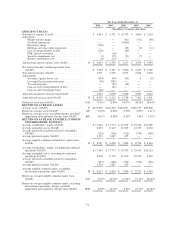
Tangible common stockholders’ equity ratios have become a focus of some investors in analyzing the
capital position of the Company absent the effects of intangible assets and preferred stock. Traditionally, the
Federal Reserve and other banking regulatory bodies have assessed a bank’s capital adequacy based on Tier 1
capital, the calculation of which is codified in federal banking regulations. In connection with the Federal
Reserve’s Supervisory Capital Assessment Program (“SCAP”), these regulators began supplementing their
assessment of the capital adequacy of a bank based on a variation of Tier 1 capital, known as Tier 1 common
equity. While not codified, analysts and banking regulators have assessed Regions’ capital adequacy using the
tangible common stockholders’ equity and/or the Tier 1 common equity measure. Because tangible common
stockholders’ equity and Tier 1 common equity are not formally defined by GAAP or codified in the federal
banking regulations, these measures are considered to be non-GAAP financial measures and other entities may
calculate them differently than Regions’ disclosed calculations. Since analysts and banking regulators may assess
Regions’ capital adequacy using tangible common stockholders’ equity and Tier 1 common equity, Regions
believes that it is useful to provide investors the ability to assess Regions’ capital adequacy on these same bases.
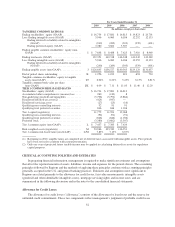
Tier 1 common equity is often expressed as a percentage of risk-weighted assets. Under the risk-based
capital framework, a bank’s balance sheet assets and credit equivalent amounts of off-balance sheet items are
assigned to one of four broad risk categories. The aggregated dollar amount in each category is then multiplied
by the risk weighting assigned to that category. The resulting weighted values from each of the four categories
are added together and this sum is the risk-weighted assets total that, as adjusted, comprises the denominator of
certain risk-based capital ratios. Tier 1 capital is then divided by this denominator (risk-weighted assets) to
determine the Tier 1 capital ratio. Adjustments are made to Tier 1 capital to arrive at Tier 1 common equity (non-
GAAP). Tier 1 common equity is also divided by the risk-weighted assets to determine the Tier 1 common equity
ratio. The amounts disclosed as risk-weighted assets are calculated consistent with banking regulatory
requirements.
Non-GAAP financial measures have inherent limitations, are not required to be uniformly applied and are
not audited. To mitigate these limitations, Regions has policies and procedures in place to identify and address
expenses that qualify for non-GAAP presentation, including authorization and system controls to ensure accurate
period-to-period comparisons. Although these non-GAAP financial measures are frequently used by stakeholders
in the evaluation of a company, they have limitations as analytical tools, and should not be considered in
isolation, or as a substitute for analyses of results as reported under GAAP. In particular, a measure of earnings
that excludes the merger, goodwill impairment and regulatory charges does not represent the amount that
effectively accrues directly to stockholders (i.e., the merger, goodwill impairment and regulatory charges are a
reduction to earnings and stockholders’ equity).
49