Regions Bank 2010 Annual Report Download - page 133
Download and view the complete annual report
Please find page 133 of the 2010 Regions Bank annual report below. You can navigate through the pages in the report by either clicking on the pages listed below, or by using the keyword search tool below to find specific information within the annual report.-
 1
1 -
2
-
3
-
4
-
5
-
6
-
7
-
8
-
9
-
10
-
11
-
12
-
13
-
14
-
15
-
16
-
17
-
18
-
19
-
20
-
21
-
22
-
23
-
24
-
25
-
26
-
27
-
28
-
29
-
30
-
31
-
32
-
33
-
34
-
35
-
36
-
37
-
38
-
39
-
40
-
41
-
42
-
43
-
44
-
45
-
46
-
47
-
48
-
49
-
50
-
51
-
52
-
53
-
54
-
55
-
56
-
57
-
58
-
59
-
60
-
61
-
62
-
63
-
64
-
65
-
66
-
67
-
68
-
69
-
70
-
71
-
72
-
73
-
74
-
75
-
76
-
77
-
78
-
79
-
80
-
81
-
82
-
83
-
84
-
85
-
86
-
87
-
88
-
89
-
90
-
91
-
92
-
93
-
94
-
95
-
96
-
97
-
98
-
99
-
100
-
101
-
102
-
103
-
104
-
105
-
106
-
107
-
108
-
109
-
110
-
111
-
112
-
113
-
114
-
115
-
116
-
117
-
118
-
119
-
120
-
121
-
122
-
 123
123 -
 124
124 -
 125
125 -
 126
126 -
 127
127 -
 128
128 -
 129
129 -
 130
130 -
 131
131 -
 132
132 -
 133
133 -
 134
134 -
 135
135 -
 136
136 -
 137
137 -
 138
138 -
 139
139 -
 140
140 -
 141
141 -
 142
142 -
 143
143 -
144
-
145
-
146
-
147
-
148
-
149
-
150
-
151
-
152
-
153
-
154
-
155
-
156
-
157
-
158
-
159
-
160
-
161
-
162
-
163
-
164
-
165
-
166
-
167
-
168
-
169
-
170
-
171
-
172
-
173
-
174
-
175
-
176
-
177
-
178
-
179
-
180
-
181
-
182
-
183
-
184
-
185
-
186
-
187
-
188
-
189
-
190
-
191
-
192
-
193
-
194
-
195
-
196
-
197
-
198
-
199
-
200
-
201
-
202
-
203
-
204
-
205
-
206
-
207
-
208
-
209
-
210
-
211
-
212
-
213
-
214
-
215
-
216
-
217
-
218
-
219
-
220
-
221
-
222
-
223
-
224
-
225
-
226
-
227
-
228
-
229
-
230
-
231
-
232
-
233
-
234
-
235
-
236
 |
 |

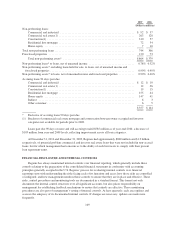
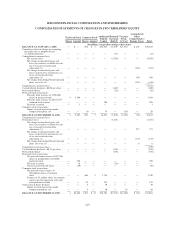
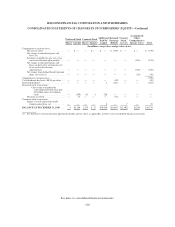
REGIONS FINANCIAL CORPORATION AND SUBSIDIARIES
CONSOLIDATED STATEMENTS OF CHANGES IN STOCKHOLDERS' EQUITY
Preferred Stock Common Stock Additional
Paid-In
Capital
Retained
Earnings
(Deficit)
Treasury
Stock,
At Cost
Accumulated
Other
Comprehensive
Income (Loss) TotalShares Amount Shares Amount
(In millions, except share and per share data)
BALANCE AT JANUARY 1, 2008 ....... — $ — 694 $ 7 $16,545 $ 4,439 $(1,371) $ 203 $19,823
Cumulative effect of change in accounting
principles due to adoption of new
accounting literature .................. — — — — — (17) — — (17)
Comprehensive income (loss):
Net income (loss) .................. — — — — — (5,596) — — (5,596)
Net change in unrealized gains and
losses on securities available for sale,
net of tax and reclassification
adjustment (1) ................... — — — — — — — (101) (101)
Net change in unrealized gains and
losses on derivative instruments, net
of tax and reclassification
adjustment (1) ................... — — — — — — — 190 190
Net change from defined benefit pension
plans, net of tax (1) ............... — — — — — — — (314) (314)
Comprehensive income (loss) ............. (5,821)
Cash dividends declared—$0.96 per share . . . — — — — — (669) — — (669)
Preferred dividends ..................... — — — — — (26) — — (26)
Preferred stock transactions:
Proceeds from issuance of 3,500,000
shares of preferred stock ........... 4 3,304 — — — — — — 3,304
Proceeds from issuance of 48,253,677
common stock warrant ............ — — — — 196 — — — 196
Discount accretion .................. — 3 — — — — — — 3
Common stock transactions:
Impact of stock transactions under
compensation plans, net ........... — — (3) — 74 — (54) — 20
BALANCE AT DECEMBER 31, 2008 .... 4 3,307 691 7 16,815 (1,869) (1,425) (22) 16,813
Comprehensive income (loss):
Net income (loss) ...................... — — — — — (1,031) — — (1,031)
Net change in unrealized gains and
losses on securities available for sale,
net of tax and reclassification
adjustment (1) ................... — — — — — — — 277 277
Net change in unrealized gains and
losses on derivative instruments, net
of tax and reclassification
adjustment (1) ................... — — — — — — — (133) (133)
Net change from defined benefit pension
plans, net of tax (1) ............... — — — — — — — 8 8
Comprehensive income (loss) ............. (879)
Cash dividends declared—$0.13 per share . . . — — — — — (105) — — (105)
Preferred dividends ..................... — — — — — (194) — — (194)
Preferred stock transactions:
Net proceeds from issuance of 287,500
shares of mandatorily convertible
preferred stock ................... — 278 — — — — — — 278
Discount accretion .................. — 36 — — — (36) — — —
Conversion of Series B shares ........ — (19) — — — — — — (19)
Common stock transactions:
Net proceeds from issuance of
460 million shares of common
stock .......................... — — 460 5 1,764 — — — 1,769
Issuance of 33 million shares of common
stock issued in connection with early
extinguishment of debt ............ — — 33 — 135 — — — 135
Conversion of Series B shares — — 5 — 19 — — — 19
Impact of stock transactions under
compensation plans, net ........... — — 4 — 48 — 16 — 64
BALANCE AT DECEMBER 31, 2009 .... 4 $3,602 1,193 $ 12 $18,781 $(3,235) $(1,409) $ 130 $17,881
119