Regions Bank 2010 Annual Report Download - page 170
Download and view the complete annual report
Please find page 170 of the 2010 Regions Bank annual report below. You can navigate through the pages in the report by either clicking on the pages listed below, or by using the keyword search tool below to find specific information within the annual report.-
 1
1 -
2
-
3
-
4
-
5
-
6
-
7
-
8
-
9
-
10
-
11
-
12
-
13
-
14
-
15
-
16
-
17
-
18
-
19
-
20
-
21
-
22
-
23
-
24
-
25
-
26
-
27
-
28
-
29
-
30
-
31
-
32
-
33
-
34
-
35
-
36
-
37
-
38
-
39
-
40
-
41
-
42
-
43
-
44
-
45
-
46
-
47
-
48
-
49
-
50
-
51
-
52
-
53
-
54
-
55
-
56
-
57
-
58
-
59
-
60
-
61
-
62
-
63
-
64
-
65
-
66
-
67
-
68
-
69
-
70
-
71
-
72
-
73
-
74
-
75
-
76
-
77
-
78
-
79
-
80
-
81
-
82
-
83
-
84
-
85
-
86
-
87
-
88
-
89
-
90
-
91
-
92
-
93
-
94
-
95
-
96
-
97
-
98
-
99
-
100
-
101
-
102
-
103
-
104
-
105
-
106
-
107
-
108
-
109
-
110
-
111
-
112
-
113
-
114
-
115
-
116
-
117
-
118
-
119
-
120
-
121
-
122
-
123
-
124
-
125
-
126
-
127
-
128
-
129
-
130
-
131
-
132
-
133
-
134
-
135
-
136
-
137
-
138
-
139
-
140
-
141
-
142
-
143
-
144
-
145
-
146
-
147
-
148
-
149
-
150
-
151
-
152
-
153
-
154
-
155
-
156
-
157
-
158
-
159
-
 160
160 -
 161
161 -
 162
162 -
 163
163 -
 164
164 -
 165
165 -
 166
166 -
 167
167 -
 168
168 -
 169
169 -
 170
170 -
 171
171 -
 172
172 -
 173
173 -
 174
174 -
 175
175 -
 176
176 -
 177
177 -
 178
178 -
 179
179 -
 180
180 -
181
-
182
-
183
-
184
-
185
-
186
-
187
-
188
-
189
-
190
-
191
-
192
-
193
-
194
-
195
-
196
-
197
-
198
-
199
-
200
-
201
-
202
-
203
-
204
-
205
-
206
-
207
-
208
-
209
-
210
-
211
-
212
-
213
-
214
-
215
-
216
-
217
-
218
-
219
-
220
-
221
-
222
-
223
-
224
-
225
-
226
-
227
-
228
-
229
-
230
-
231
-
232
-
233
-
234
-
235
-
236
 |
 |

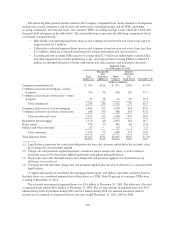
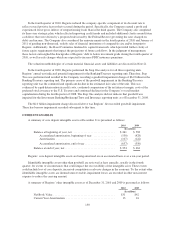
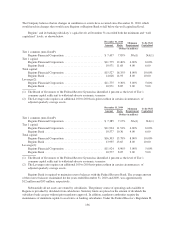
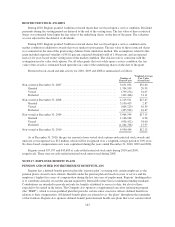
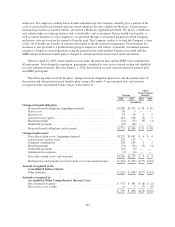
The Company believes that no changes in conditions or events have occurred since December 31, 2010, which
would result in changes that would cause Regions or Regions Bank to fall below the well capitalized level.
Regions’ and its banking subsidiary’s capital levels at December 31 exceeded both the minimum and “well
capitalized” levels, as shown below:
December 31, 2010 Minimum
Requirement
To Be Well
CapitalizedAmount Ratio
(Dollars in millions)
Tier 1 common (non-GAAP):
Regions Financial Corporation .......................... $ 7,457 7.85% NA(1) NA(1)
Tier 1 capital:
Regions Financial Corporation .......................... $11,775 12.40% 4.00% 6.00%
Regions Bank ........................................ 10,971 11.68 4.00 6.00
Total capital:
Regions Financial Corporation .......................... $15,527 16.35% 8.00% 10.00%
Regions Bank ........................................ 14,028 14.93 8.00 10.00
Leverage(2):
Regions Financial Corporation .......................... $11,775 9.30% 3.00% 5.00%
Regions Bank ........................................ 10,971 8.85 3.00 5.00
(1) The Board of Governors of the Federal Reserve System has identified 4 percent as the level of Tier 1
common capital sufficient to withstand adverse economic scenarios.
(2) The Leverage ratio requires an additional 100 to 200 basis-point cushion in certain circumstances, of
adjusted quarterly average assets.
December 31, 2009 Minimum
Requirement
To Be Well
CapitalizedAmount Ratio
(Dollars in millions)
Tier 1 common (non-GAAP):
Regions Financial Corporation .......................... $ 7,385 7.15% NA(1) NA(1)
Tier 1 capital:
Regions Financial Corporation .......................... $11,924 11.54% 4.00% 6.00%
Regions Bank ........................................ 10,577 10.36 4.00 6.00
Total capital:
Regions Financial Corporation .......................... $16,303 15.78% 8.00% 10.00%
Regions Bank ........................................ 13,935 13.65 8.00 10.00
Leverage(2):
Regions Financial Corporation .......................... $11,924 8.90% 3.00% 5.00%
Regions Bank ........................................ 10,577 8.05 3.00 5.00
(1) The Board of Governors of the Federal Reserve System has identified 4 percent as the level of Tier 1
common capital sufficient to withstand adverse economic scenarios.
(2) The Leverage ratio requires an additional 100 to 200 basis-point cushion in certain circumstances, of
adjusted quarterly average assets.
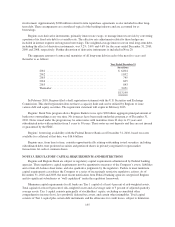
Regions Bank is required to maintain reserve balances with the Federal Reserve Bank. The average amount
of the reserve balances maintained for the years ended December 31, 2010 and 2009, was approximately
$12 million and $35 million, respectively.
Substantially all net assets are owned by subsidiaries. The primary source of operating cash available to
Regions is provided by dividends from subsidiaries. Statutory limits are placed on the amount of dividends the
subsidiary bank can pay without prior regulatory approval. In addition, regulatory authorities require the
maintenance of minimum capital-to-asset ratios at banking subsidiaries. Under the Federal Reserve’s Regulation H,
156