Regions Bank 2010 Annual Report Download - page 160
Download and view the complete annual report
Please find page 160 of the 2010 Regions Bank annual report below. You can navigate through the pages in the report by either clicking on the pages listed below, or by using the keyword search tool below to find specific information within the annual report.-
 1
1 -
2
-
3
-
4
-
5
-
6
-
7
-
8
-
9
-
10
-
11
-
12
-
13
-
14
-
15
-
16
-
17
-
18
-
19
-
20
-
21
-
22
-
23
-
24
-
25
-
26
-
27
-
28
-
29
-
30
-
31
-
32
-
33
-
34
-
35
-
36
-
37
-
38
-
39
-
40
-
41
-
42
-
43
-
44
-
45
-
46
-
47
-
48
-
49
-
50
-
51
-
52
-
53
-
54
-
55
-
56
-
57
-
58
-
59
-
60
-
61
-
62
-
63
-
64
-
65
-
66
-
67
-
68
-
69
-
70
-
71
-
72
-
73
-
74
-
75
-
76
-
77
-
78
-
79
-
80
-
81
-
82
-
83
-
84
-
85
-
86
-
87
-
88
-
89
-
90
-
91
-
92
-
93
-
94
-
95
-
96
-
97
-
98
-
99
-
100
-
101
-
102
-
103
-
104
-
105
-
106
-
107
-
108
-
109
-
110
-
111
-
112
-
113
-
114
-
115
-
116
-
117
-
118
-
119
-
120
-
121
-
122
-
123
-
124
-
125
-
126
-
127
-
128
-
129
-
130
-
131
-
132
-
133
-
134
-
135
-
136
-
137
-
138
-
139
-
140
-
141
-
142
-
143
-
144
-
145
-
146
-
147
-
148
-
149
-
 150
150 -
 151
151 -
 152
152 -
 153
153 -
 154
154 -
 155
155 -
 156
156 -
 157
157 -
 158
158 -
 159
159 -
 160
160 -
 161
161 -
 162
162 -
 163
163 -
 164
164 -
 165
165 -
 166
166 -
 167
167 -
 168
168 -
 169
169 -
 170
170 -
171
-
172
-
173
-
174
-
175
-
176
-
177
-
178
-
179
-
180
-
181
-
182
-
183
-
184
-
185
-
186
-
187
-
188
-
189
-
190
-
191
-
192
-
193
-
194
-
195
-
196
-
197
-
198
-
199
-
200
-
201
-
202
-
203
-
204
-
205
-
206
-
207
-
208
-
209
-
210
-
211
-
212
-
213
-
214
-
215
-
216
-
217
-
218
-
219
-
220
-
221
-
222
-
223
-
224
-
225
-
226
-
227
-
228
-
229
-
230
-
231
-
232
-
233
-
234
-
235
-
236
 |
 |

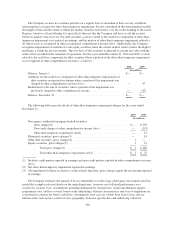
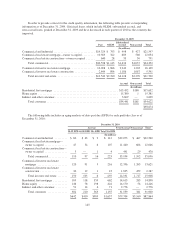
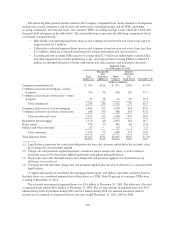
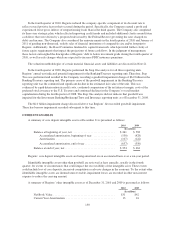
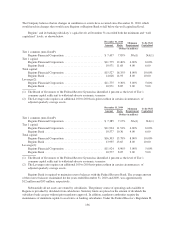
The following table presents details related to the Company’s impaired loans. Loans deemed to be impaired
include non-accrual commercial and investor real estate loans, excluding leasing, and all TDRs (including
accruing commercial, investor real estate, and consumer TDRs, excluding leasing). Loans which have been fully
charged-off do not appear in the table below. The related allowance represents the following components which
correspond to impaired loans:
• Individually evaluated impaired loans (non-accrual commercial and investor real estate loans equal to
or greater than $2.5 million),
• Collectively evaluated impaired loans (non-accrual commercial and investor real estate loans less than
$2.5 million, which are evaluated based on pools of loans with similar risk characteristics),
• Accruing and non-accruing TDRs equal to or greater than $2.5 million are individually evaluated like
any other impaired loan over the quantitative scope. Accruing and non-accruing TDRs less than $2.5
million are included with pools of loans with similar risk characteristics and evaluated collectively.
Impaired Loans
As of December 31, 2010
Legal
Balance (1)
Charge-offs
and
Payments
Applied (2)
Book
Value (3)
Related
Allowance
for
Loan Losses Coverage% (4)
(Dollars in millions)
Commercial and industrial ................... $ 545 $124 $ 421 $102 41.5%
Commercial real estate mortgage—owner
occupied ............................... 746 96 650 167 35.3
Commercial real estate construction—owner
occupied ............................... 47 16 31 10 55.3
Total commercial ...................... 1,338 236 1,102 279 38.5
Commercial investor real estate mortgage ...... 1,693 273 1,420 319 35.0
Commercial investor real estate construction .... 638 150 488 154 47.6
Total investor real estate ................ 2,331 423 1,908 473 38.4
Residential first mortgage ................... 1,113 60 1,053 126 16.7
Home equity .............................. 378 13 365 46 15.6
Indirect and other consumer ................. 67 — 67 1 1.5
Total consumer ....................... 1,558 73 1,485 173 15.8
Total impaired loans ....................... $5,227 $732 $4,495 $925 31.7%
(1) Legal balance represents the contractual obligation due from the customer and includes the net book value
plus charge-offs and payments applied.
(2) Charge-offs and payments applied represents cumulative partial charge-offs taken, as well as interest
payments received that have been applied against the outstanding principal balance.
(3) Book value represents the legal balance less charge-offs and payments applied; it is shown before any
allowance for loan losses.
(4) Coverage percent represents charge-offs and payments applied plus the related allowance as a percent of the
legal balance.
A significant majority of residential first mortgage, home equity, and indirect and other consumer loans in
the table above are considered impaired due to their status as a TDR. Over 80 percent of consumer TDRs were
accruing at December 31, 2010.
The recorded investment in impaired loans was $5.0 billion at December 31, 2009. The allowance allocated
to impaired loans totaled $662 million at December 31, 2009. The average amount of impaired loans was $4.8
billion during 2010, $3.6 billion during 2009 and $1.3 billion during 2008. No material amount of interest
income was recognized on impaired loans for the years ended December 31, 2010, 2009 or 2008.
146