Regions Bank 2010 Annual Report Download - page 163
Download and view the complete annual report
Please find page 163 of the 2010 Regions Bank annual report below. You can navigate through the pages in the report by either clicking on the pages listed below, or by using the keyword search tool below to find specific information within the annual report.-
 1
1 -
2
-
3
-
4
-
5
-
6
-
7
-
8
-
9
-
10
-
11
-
12
-
13
-
14
-
15
-
16
-
17
-
18
-
19
-
20
-
21
-
22
-
23
-
24
-
25
-
26
-
27
-
28
-
29
-
30
-
31
-
32
-
33
-
34
-
35
-
36
-
37
-
38
-
39
-
40
-
41
-
42
-
43
-
44
-
45
-
46
-
47
-
48
-
49
-
50
-
51
-
52
-
53
-
54
-
55
-
56
-
57
-
58
-
59
-
60
-
61
-
62
-
63
-
64
-
65
-
66
-
67
-
68
-
69
-
70
-
71
-
72
-
73
-
74
-
75
-
76
-
77
-
78
-
79
-
80
-
81
-
82
-
83
-
84
-
85
-
86
-
87
-
88
-
89
-
90
-
91
-
92
-
93
-
94
-
95
-
96
-
97
-
98
-
99
-
100
-
101
-
102
-
103
-
104
-
105
-
106
-
107
-
108
-
109
-
110
-
111
-
112
-
113
-
114
-
115
-
116
-
117
-
118
-
119
-
120
-
121
-
122
-
123
-
124
-
125
-
126
-
127
-
128
-
129
-
130
-
131
-
132
-
133
-
134
-
135
-
136
-
137
-
138
-
139
-
140
-
141
-
142
-
143
-
144
-
145
-
146
-
147
-
148
-
149
-
150
-
151
-
152
-
 153
153 -
 154
154 -
 155
155 -
 156
156 -
 157
157 -
 158
158 -
 159
159 -
 160
160 -
 161
161 -
 162
162 -
 163
163 -
 164
164 -
 165
165 -
 166
166 -
 167
167 -
 168
168 -
 169
169 -
 170
170 -
 171
171 -
 172
172 -
 173
173 -
174
-
175
-
176
-
177
-
178
-
179
-
180
-
181
-
182
-
183
-
184
-
185
-
186
-
187
-
188
-
189
-
190
-
191
-
192
-
193
-
194
-
195
-
196
-
197
-
198
-
199
-
200
-
201
-
202
-
203
-
204
-
205
-
206
-
207
-
208
-
209
-
210
-
211
-
212
-
213
-
214
-
215
-
216
-
217
-
218
-
219
-
220
-
221
-
222
-
223
-
224
-
225
-
226
-
227
-
228
-
229
-
230
-
231
-
232
-
233
-
234
-
235
-
236
 |
 |

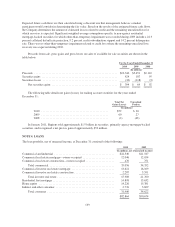
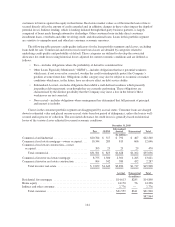
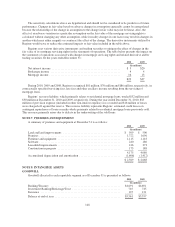
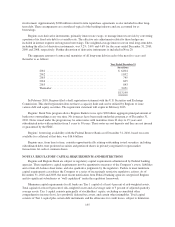
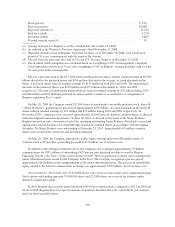
A summary of goodwill activity at December 31 is presented as follows:
2010 2009
(In millions)
Balance at beginning of year ......................................... $5,557 $5,548
Acquisitions of other businesses ...................................... 4 9
Impairment ....................................................... — —
Balance at end of year .............................................. $5,561 $5,557
As stated in Note 1, Regions evaluates each reporting unit’s goodwill for impairment on an annual basis in
the fourth quarter, or more often if events or circumstances indicate that there may be impairment. Regions tested
goodwill for impairment periodically during 2010, 2009 and 2008 and recorded a $6.0 billion impairment charge
within the Banking/Treasury unit during the fourth quarter of 2008. Due to the deteriorating economic
environment in 2010 and 2009, Regions performed interim impairment tests in each quarter of 2010 and during
the second and third quarters of 2009, in addition to the 2010 and 2009 annual tests which occur during the fourth
quarter. The results of these interim and annual tests indicated that goodwill was not impaired as of these test
dates.
In the fourth quarter of 2010, Regions performed the Step One analysis for all three reporting units as part of
its annual impairment test, which indicated potential impairment for the Banking/Treasury reporting unit. Based
on the results of the Step Two analysis performed, Regions concluded the Banking/Treasury reporting unit’s
goodwill was not impaired. The Step One analysis did not indicate that goodwill was impaired for the Investment
Banking/Brokerage/Trust and Insurance reporting units as of December 31, 2010.
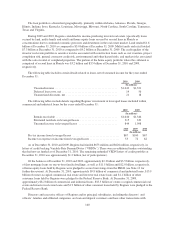
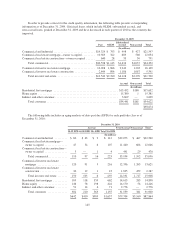
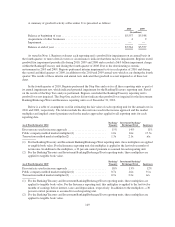
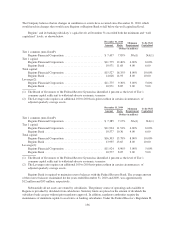
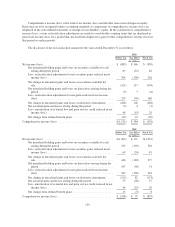
Below is a table of assumptions used in estimating the fair value of each reporting unit for the annual tests in
2010 and 2009, respectively. The tables include the discount rate used in the income approach and the market
multiplier and implied control premium used in the market approaches applied to all reporting units for each
reporting date.
As of Fourth Quarter 2010
Banking/
Treasury
Investment Banking/
Brokerage/Trust Insurance
Discount rate used in income approach ........................... 15% 14% 11%
Public company method market multiplier(1) ..................... 1.0x 1.6x 17.3x
Transaction method market multiplier(2) ......................... 1.3x 2.1x n/a
(1) For the Banking/Treasury and Investment Banking/Brokerage/Trust reporting units, these multipliers are applied
to tangible book value. For the Insurance reporting unit, this multiplier is applied to the last twelve months of
net income. In addition to the multipliers, a 30 percent control premium is assumed for each reporting unit.
(2) For the Banking/Treasury and Investment Banking/Brokerage/Trust reporting units, these multipliers are
applied to tangible book value.
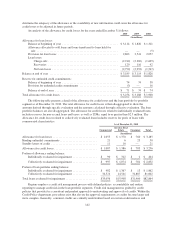
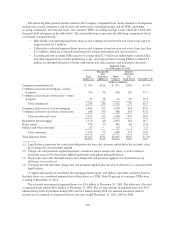
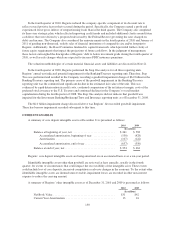
As of Fourth Quarter 2009
Banking/
Treasury
Investment Banking/
Brokerage/Trust Insurance
Discount rate used in income approach ........................... 18% 13% 12%
Public company method market multiplier(1) ..................... 0.7x 1.6x 9.1x
Transaction method market multiplier(2) ......................... 0.9x 2.2x n/a
(1) For the Banking/Treasury and Investment Banking/Brokerage/Trust reporting units, these multipliers are
applied to tangible book value. For the Insurance reporting unit, this multiplier is applied to the last twelve
months of earnings before interest, taxes and depreciation, respectively. In addition to the multipliers, a 30
percent control premium is assumed for each reporting unit.
(2) For the Banking/Treasury and Investment Banking/Brokerage/Trust reporting units, these multipliers are
applied to tangible book value.
149