Regions Bank 2010 Annual Report Download - page 113
Download and view the complete annual report
Please find page 113 of the 2010 Regions Bank annual report below. You can navigate through the pages in the report by either clicking on the pages listed below, or by using the keyword search tool below to find specific information within the annual report.-
 1
1 -
2
-
3
-
4
-
5
-
6
-
7
-
8
-
9
-
10
-
11
-
12
-
13
-
14
-
15
-
16
-
17
-
18
-
19
-
20
-
21
-
22
-
23
-
24
-
25
-
26
-
27
-
28
-
29
-
30
-
31
-
32
-
33
-
34
-
35
-
36
-
37
-
38
-
39
-
40
-
41
-
42
-
43
-
44
-
45
-
46
-
47
-
48
-
49
-
50
-
51
-
52
-
53
-
54
-
55
-
56
-
57
-
58
-
59
-
60
-
61
-
62
-
63
-
64
-
65
-
66
-
67
-
68
-
69
-
70
-
71
-
72
-
73
-
74
-
75
-
76
-
77
-
78
-
79
-
80
-
81
-
82
-
83
-
84
-
85
-
86
-
87
-
88
-
89
-
90
-
91
-
92
-
93
-
94
-
95
-
96
-
97
-
98
-
99
-
100
-
101
-
102
-
 103
103 -
 104
104 -
 105
105 -
 106
106 -
 107
107 -
 108
108 -
 109
109 -
 110
110 -
 111
111 -
 112
112 -
 113
113 -
 114
114 -
 115
115 -
 116
116 -
 117
117 -
 118
118 -
 119
119 -
 120
120 -
 121
121 -
 122
122 -
 123
123 -
124
-
125
-
126
-
127
-
128
-
129
-
130
-
131
-
132
-
133
-
134
-
135
-
136
-
137
-
138
-
139
-
140
-
141
-
142
-
143
-
144
-
145
-
146
-
147
-
148
-
149
-
150
-
151
-
152
-
153
-
154
-
155
-
156
-
157
-
158
-
159
-
160
-
161
-
162
-
163
-
164
-
165
-
166
-
167
-
168
-
169
-
170
-
171
-
172
-
173
-
174
-
175
-
176
-
177
-
178
-
179
-
180
-
181
-
182
-
183
-
184
-
185
-
186
-
187
-
188
-
189
-
190
-
191
-
192
-
193
-
194
-
195
-
196
-
197
-
198
-
199
-
200
-
201
-
202
-
203
-
204
-
205
-
206
-
207
-
208
-
209
-
210
-
211
-
212
-
213
-
214
-
215
-
216
-
217
-
218
-
219
-
220
-
221
-
222
-
223
-
224
-
225
-
226
-
227
-
228
-
229
-
230
-
231
-
232
-
233
-
234
-
235
-
236
 |
 |

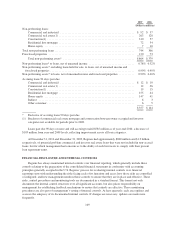
2010 2009
(In millions, net of
unearned income)
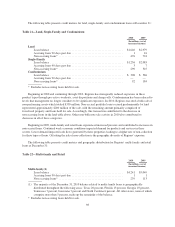
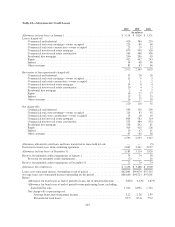
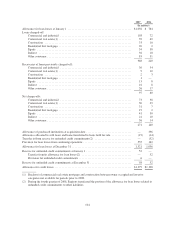
Retail(2)
Loan balance ................................................... $3,099 $4,120
Accruing loans 90 days past due .................................... — 4
Non-accruing loans* ............................................. 177 288
(2) The majority of the December 31, 2010 balance related to retail loans is geographically distributed
throughout the following areas: Florida 24 percent, Texas 12 percent, Georgia 10 percent, Alabama 9
percent, Tennessee 7 percent and North Carolina 7 percent. All other states, none of which comprise
more than 4 percent, make up the remainder of the balance.
* Excludes non-accruing loans held for sale.
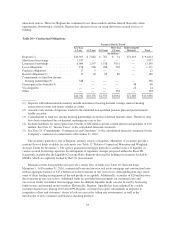
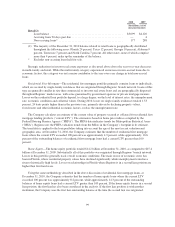
Strategic reductions in investor real estate exposures as discussed above drove the year-over-year decreases
in multi-family and retail. While the multi-family category experienced an increase in non-accrual loans due to
economic factors, this category was not a major contributor to the year-over-year change in total non-accrual
loans.
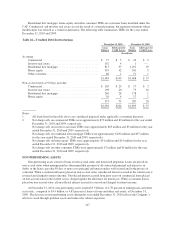
Residential First Mortgage—The residential first mortgage portfolio primarily contains loans to individuals,
which are secured by single-family residences that are originated through Regions’ branch network. Loans of this
type are generally smaller in size than commercial or investor real estate loans and are geographically dispersed
throughout Regions’ market areas, with some guaranteed by government agencies or private mortgage insurers.
Losses on the residential loan portfolio depend, to a large degree, on the level of interest rates, the unemployment
rate, economic conditions and collateral values. During 2010, losses on single-family residences totaled 1.53
percent, 24 basis points higher than in the previous year, primarily driven by declining property values,
foreclosures and other influential economic factors, such as the unemployment rate.
The Company calculates an estimate of the current value of property secured as collateral for residential first
mortgage lending products (“current LTV”). The estimate is based on home price indices compiled by the
Federal Housing Finance Agency (“FHFA”). The FHFA data indicates trends for Metropolitan Statistical Areas
(“MSA”). Regions uses the FHFA valuation trends from the MSAs in the Company’s footprint in its estimate.
The trend data is applied to the loan portfolios taking into account the age of the most recent valuation and
geographic area. At December 31, 2010, the Company estimates that the number of residential first mortgage
loans where the current LTV exceeded 100 percent was approximately 4.9 percent, while approximately 10.6
percent of the outstanding balances of residential first mortgage loans had a current LTV greater than 100
percent.
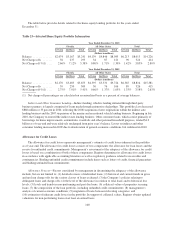
Home Equity—The home equity portfolio totaled $14.2 billion at December 31, 2010, as compared to $15.4
billion at December 31, 2009. Substantially all of this portfolio was originated through Regions’ branch network.
Losses in this portfolio generally track overall economic conditions. The main source of economic stress has
been in Florida, where residential property values have declined significantly while unemployment rates have
risen to historically high levels. Losses on relationships in Florida where Regions is in a second lien position are
higher than first lien losses.
Using the same methodology described in the above discussion of residential first mortgage loans, at
December 31, 2010, the Company estimates that the number of home equity loans where the current LTV
exceeded 100 percent was approximately 8.2 percent, while approximately 14.3 percent of the outstanding
balances of home equity loans had a current LTV greater than 100 percent. If the home equity loan is in a second
lien position, the first lien has also been considered in the analysis. If the first lien position is with another
institution, the Company uses the first lien outstanding balance at the time the second lien was originated.
99