Regions Bank 2010 Annual Report Download - page 61
Download and view the complete annual report
Please find page 61 of the 2010 Regions Bank annual report below. You can navigate through the pages in the report by either clicking on the pages listed below, or by using the keyword search tool below to find specific information within the annual report.-
 1
1 -
2
-
3
-
4
-
5
-
6
-
7
-
8
-
9
-
10
-
11
-
12
-
13
-
14
-
15
-
16
-
17
-
18
-
19
-
20
-
21
-
22
-
23
-
24
-
25
-
26
-
27
-
28
-
29
-
30
-
31
-
32
-
33
-
34
-
35
-
36
-
37
-
38
-
39
-
40
-
41
-
42
-
43
-
44
-
45
-
46
-
47
-
48
-
49
-
50
-
 51
51 -
 52
52 -
 53
53 -
 54
54 -
 55
55 -
 56
56 -
 57
57 -
 58
58 -
 59
59 -
 60
60 -
 61
61 -
 62
62 -
 63
63 -
 64
64 -
 65
65 -
 66
66 -
 67
67 -
 68
68 -
 69
69 -
 70
70 -
 71
71 -
72
-
73
-
74
-
75
-
76
-
77
-
78
-
79
-
80
-
81
-
82
-
83
-
84
-
85
-
86
-
87
-
88
-
89
-
90
-
91
-
92
-
93
-
94
-
95
-
96
-
97
-
98
-
99
-
100
-
101
-
102
-
103
-
104
-
105
-
106
-
107
-
108
-
109
-
110
-
111
-
112
-
113
-
114
-
115
-
116
-
117
-
118
-
119
-
120
-
121
-
122
-
123
-
124
-
125
-
126
-
127
-
128
-
129
-
130
-
131
-
132
-
133
-
134
-
135
-
136
-
137
-
138
-
139
-
140
-
141
-
142
-
143
-
144
-
145
-
146
-
147
-
148
-
149
-
150
-
151
-
152
-
153
-
154
-
155
-
156
-
157
-
158
-
159
-
160
-
161
-
162
-
163
-
164
-
165
-
166
-
167
-
168
-
169
-
170
-
171
-
172
-
173
-
174
-
175
-
176
-
177
-
178
-
179
-
180
-
181
-
182
-
183
-
184
-
185
-
186
-
187
-
188
-
189
-
190
-
191
-
192
-
193
-
194
-
195
-
196
-
197
-
198
-
199
-
200
-
201
-
202
-
203
-
204
-
205
-
206
-
207
-
208
-
209
-
210
-
211
-
212
-
213
-
214
-
215
-
216
-
217
-
218
-
219
-
220
-
221
-
222
-
223
-
224
-
225
-
226
-
227
-
228
-
229
-
230
-
231
-
232
-
233
-
234
-
235
-
236
 |
 |
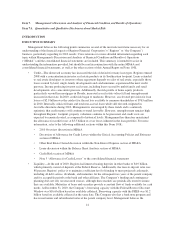
2010 OVERVIEW
Regions reported a net loss available to common shareholders of $763 million or $0.62 per diluted common
share in 2010. Significant drivers of 2010 results include an elevated provision for loan losses and other real
estate expenses, as well as a $200 million regulatory charge related to Morgan Keegan. These items were
partially offset by higher net interest income.
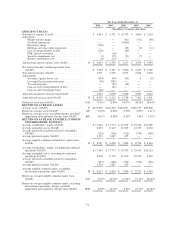
Net interest income was $3.4 billion in 2010 compared to $3.3 billion in 2009. The net interest margin
(taxable-equivalent basis) was 2.90 percent in 2010, compared to 2.67 percent during 2009. The margin
improvement was driven primarily by a decrease of 60 basis points in the cost of interest-bearing liabilities, while
being partially offset by a 30 basis point decline in the overall yield on interest earning assets. This dynamic
reflected efforts to improve deposit costs and pricing on loans, while managing the challenges posed by a low
interest rate environment. Long-term interest rates in particular remained low in 2010, pressuring yields on fixed-
rate loan and securities portfolios, and contributed to the decline in the yield on taxable securities from 4.78
percent in 2009 to 3.66 percent in 2010. The overall costs of deposits improved from 1.35 percent in 2009 to 0.78
percent in 2010, although short-term interest rates (e.g. Fed Funds) remained relatively stable. The product mix
of deposits improved as well, as declines in higher cost certificates of deposits accompanied increases in other
low cost checking, savings and money market products.
Although the net interest margin increased in 2010, the factors that have pressured it are likely to persist,
including those directly and indirectly associated with the erosion of economic and industry conditions since late
2007. These factors include a continuation of a low level of interest rates, higher costs of new debt issuances,
elevated non-performing asset levels and costs associated with managing to prudent levels of liquidity risk. The
combination of these factors may even lead to a modest decline in margin in the near term from 3.00 percent in
the fourth quarter of 2010. Additionally, management expects the net interest margin to be pressured in the near
term due in part to the recent portfolio rebalancing activity to further the Company’s capital and liquidity goals.
However, Regions’ balance sheet is in an asset sensitive position such that if economic conditions were to
improve more rapidly, thereby resulting in a rise in interest rates, the net interest margin would likely respond
favorably.
Net charge-offs totaled $2.8 billion, or 3.22 percent of average loans in 2010 compared to $2.3 billion, or
2.38 percent of average loans in 2009. The increased loss rate reflected seasoning of losses as the Company
moves through the credit cycle as well as the impact of opportunistic asset dispositions which increased charge-
offs and decreased average loan balances. Non-performing assets decreased $494 million between December 31,
2009 and December 31, 2010 to $3.9 billion.
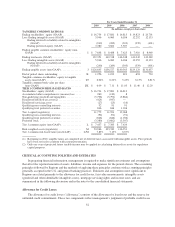
The provision for loan losses is used to maintain the allowance for loan losses at a level that, in
management’s judgment, is adequate to cover losses inherent in the loan portfolio as of the balance sheet date.
During 2010, the provision for loan losses decreased to $2.9 billion compared to $3.5 billion in 2009. The
allowance for credit losses was $3.3 billion, or 3.93 percent of loans, at December 31, 2010 as compared to $3.2
billion, or 3.52 percent of loans, at December 31, 2009. The stabilization in the level of the allowance reflects
moderating credit trends.
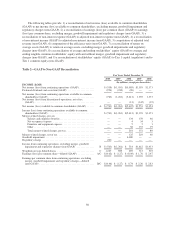
Non-interest income decreased to $3.5 billion in 2010 from $3.8 billion in 2009. The year-over-year
decrease was due primarily to several items impacting 2009 with a lower or no corresponding impact on 2010.
These 2009 items include gains from terminations of leveraged leases, which were largely offset by income
taxes, a gain on extinguishment of debt realized in connection with the Company’s issuance of common stock in
exchange for trust preferred securities, and gains related to transactions in Visa stock. Lower mortgage income,
resulting from market valuation adjustments for mortgage servicing rights and related derivatives, also drove the
year-over-year decline. The decreases were largely offset by higher gains from sales of securities in 2010, as well
as increases in non-interest income attributable to service charges and brokerage, investment banking and capital
markets income. The impact of Regulation E on service charges was less than anticipated; however, the
Company expects increased pressure on fee-based revenues in light of pending regulatory changes. See Table 2
“GAAP to Non-GAAP Reconciliation” and Table 5 “Non-Interest Income” for further details.
47