Proctor and Gamble 2007 Annual Report Download - page 70
Download and view the complete annual report
Please find page 70 of the 2007 Proctor and Gamble annual report below. You can navigate through the pages in the report by either clicking on the pages listed below, or by using the keyword search tool below to find specific information within the annual report.-
 1
1 -
2
-
3
-
4
-
5
-
6
-
7
-
8
-
9
-
10
-
11
-
12
-
13
-
14
-
15
-
16
-
17
-
18
-
19
-
20
-
21
-
22
-
23
-
24
-
25
-
26
-
27
-
28
-
29
-
30
-
31
-
32
-
33
-
34
-
35
-
36
-
37
-
38
-
39
-
40
-
41
-
42
-
43
-
44
-
45
-
46
-
47
-
48
-
49
-
50
-
51
-
52
-
53
-
54
-
55
-
56
-
57
-
58
-
59
-
 60
60 -
 61
61 -
 62
62 -
 63
63 -
 64
64 -
 65
65 -
 66
66 -
 67
67 -
 68
68 -
 69
69 -
 70
70 -
 71
71 -
 72
72 -
 73
73 -
 74
74 -
 75
75 -
 76
76 -
 77
77 -
 78
78
 |
 |

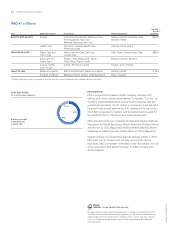
Millions of dollars except per share amounts or as otherwise specied.
Notes to Consolidated Financial Statements
The Procter & Gamble Company
68
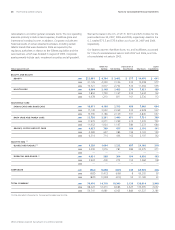
rationalization, and other general corporate items. The non-operating
elements primarily include interest expense, divestiture gains and
interest and investing income. In addition, Corporate includes the
historical results of certain divested businesses, including certain
Gillette brands that were divested in 2006 as required by the
regulatory authorities in relation to the Gillette acquisition and the
Juice business, which was divested in August of 2004. Corporate
assets primarily include cash, investment securities and all goodwill.
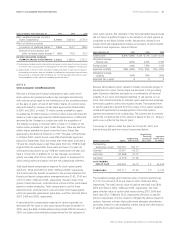
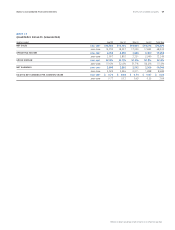
Before-Tax Depreciation & Capital
Global Segment Results Net Sales Earnings Net Earnings Amortization Total Assets Expenditures
2006 21,126 4,359 3,106 535 13,498 577
2005 19,721 3,977 2,752 535 11,494 535
2006 7,852 1,740 1,167 234 7,644 162
2005 6,078 1,210 811 161 2,536 112
2006 17,149 3,553 2,369 435 6,928 567
2005 15,796 3,186 2,129 391 6,845 647
2006 11,972 2,071 1,299 612 7,339 739
2005 11,652 1,924 1,197 580 7,272 684
2006 4,383 627 385 159 2,122 150
2005 4,314 714 444 162 2,197 142
(1)
(1)
2006 3,499 1,076 781 489 24,575 271
2005
—
—
—
—
—
—
(1)
2006 2,924 400 273 155 7,384 108
2005
—
—
—
—
—
—
2006 (683) (1,413) (696) 8 66,205 93
2005 (820) (1,030) (410) 55 31,183 61
2006 68,222 12,413 8,684 2,627 135,695 2,667
2005 56,741 9,981 6,923 1,884 61,527 2,181
(1) 2006 data reects information for the nine months ended June 30, 2006.
We had net sales in the U.S. of $31.9, $29.5 and $25.3 billion for the
years ended June 30, 2007, 2006 and 2005, respectively. Assets in the
U.S. totaled $73.5 and $75.4 billion as of June 30, 2007 and 2006,
respectively.
Our largest customer, Wal-Mart Stores, Inc. and its afliates, accounted
for 15% of consolidated net sales in both 2007 and 2006, and 16%
of consolidated net sales in 2005.