Proctor and Gamble 2007 Annual Report Download - page 5
Download and view the complete annual report
Please find page 5 of the 2007 Proctor and Gamble annual report below. You can navigate through the pages in the report by either clicking on the pages listed below, or by using the keyword search tool below to find specific information within the annual report.-
 1
1 -
 2
2 -
 3
3 -
 4
4 -
 5
5 -
 6
6 -
 7
7 -
 8
8 -
 9
9 -
 10
10 -
 11
11 -
 12
12 -
 13
13 -
 14
14 -
 15
15 -
 16
16 -
17
-
18
-
19
-
20
-
21
-
22
-
23
-
24
-
25
-
26
-
27
-
28
-
29
-
30
-
31
-
32
-
33
-
34
-
35
-
36
-
37
-
38
-
39
-
40
-
41
-
42
-
43
-
44
-
45
-
46
-
47
-
48
-
49
-
50
-
51
-
52
-
53
-
54
-
55
-
56
-
57
-
58
-
59
-
60
-
61
-
62
-
63
-
64
-
65
-
66
-
67
-
68
-
69
-
70
-
71
-
72
-
73
-
74
-
75
-
76
-
77
-
78
 |
 |

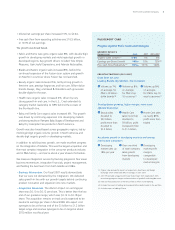
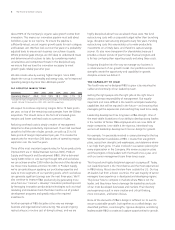
Diluted net earnings per share increased 15%, to $3.04.
Free cash ow from operating activities was $10.5 billion,
or 101% of net earnings.
The growth was broad-based.
Fabric and Home Care grew organic sales 8%, with double-digit
growth in developing markets and mid-single-digit growth in
developed regions. Key growth drivers included Tide Simple
Pleasures, Gain Joyful Expressions, and Febreze Noticeables.
Blades and Razors organic sales increased 8%, behind the
continued expansion of the Fusion razor system and growth
on Mach3 in countries where Fusion has not launched.
Beauty organic sales increased 5%, led by strong growth in
feminine care, prestige fragrances and hair care. Billion-dollar
brands Always, Olay, and Head & Shoulders each grew sales
double-digits for the year.
Health Care organic sales increased 6%, driven by very
strong growth in oral care. In the U.S., Crest extended its
category market leadership to 38% behind the success of
the Pro-Health line.
Baby and Family Care organic sales increased 4%. This growth
was driven by continuing expansion into developing markets
and strong results on Pampers Baby Stages of Development and
Baby Dry Caterpillar Flex products in North America.
Growth was also broad-based across geographic regions, led by
mid-single-digit organic volume growth in North America and
double-digit organic growth in developing markets.
In addition to solid business growth, we made excellent progress
on the integration of Gillette. This was the largest acquisition and
the most complex integration in the consumer products industry
and in P&G history
—
and we’re about a year ahead of schedule.
We measure integration success by tracking progress in four areas:
business momentum, integration nancials, project management,
and elding the best team from both Gillette and P&G.
• Business Momentum. Our scal 2007 results demonstrate
that we were not distracted by the integration. We delivered
sales growth in line with our growth targets behind continuing
product innovation and expansion into new markets.
• Integration Financials. The dilution impact on earnings per
share was $0.10 to $0.12 per share. This is better than the low
end of our guidance range, which was $0.12 to $0.18 per
share. The acquisition remains on track and is expected to be
neutral to earnings per share in scal 2008. We expect cost
synergies to be at the top end of the $1 billion to $1.2 billion
target range and revenue synergies to be on target at about
$750 million next scal year.
(1) Organic sales exclude the impacts of acquisitions, divestitures and foreign
exchange, which where were 6%, on average, in 2001-2007.
(2) 2001 EPS excludes a negative $0.61 per share impact from Organization 2005
restructuring program charges and amortization of goodwill and intangible assets.
(3) Free cash ow productivity is the ratio of free cash ow to net earnings.
(4) Excludes the impact of adding newly acquired billion-dollar brands to the portfolio.
(5) Excludes impact of adding Gillette.
&
&
Average annual 2007 2001–2007
Organic Sales Growth (1) 5% 6%
Earnings-per-Share Growth 15% 12%(2)
Free Cash Flow Productivity (3) 101% 120%
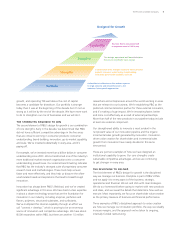
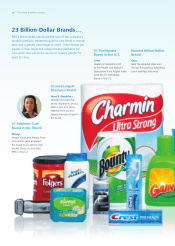
Grow from the core:
Leading Brands, Big Markets, Top Customers
Volume up 7%,
on average, for
P&G’s 23 billion-
dollar brands (4)
Volume up 8%,
on average,
for P&G’s top
16 countries (5)
Volume up 8%,
on average,
for P&G’s top 10
retail customers (5)
Beauty sales
doubled to
$23 billion;
prot more than
doubled to
$3.5 billion
Health Care
sales more than
doubled to
$9 billion; prot
increased 6-fold
to $1.5 billion
Home Care sales
up nearly 85%;
prot more than
tripled
Develop faster-growing, higher-margin, more asset-
efcient businesses
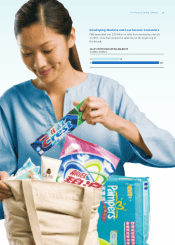
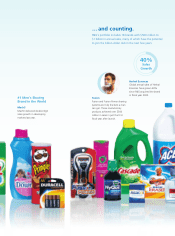
Accelerate growth in developing markets and among
low-income consumers
Developing
market sales up
18% per year
Over one-third
of total-company
sales growth
from developing
markets
Developing
market prot
margins
comparable
to developed-
market margins
The Procter & Gamble Company 3