Proctor and Gamble 2007 Annual Report Download - page 50
Download and view the complete annual report
Please find page 50 of the 2007 Proctor and Gamble annual report below. You can navigate through the pages in the report by either clicking on the pages listed below, or by using the keyword search tool below to find specific information within the annual report.-
 1
1 -
2
-
3
-
4
-
5
-
6
-
7
-
8
-
9
-
10
-
11
-
12
-
13
-
14
-
15
-
16
-
17
-
18
-
19
-
20
-
21
-
22
-
23
-
24
-
25
-
26
-
27
-
28
-
29
-
30
-
31
-
32
-
33
-
34
-
35
-
36
-
37
-
38
-
39
-
 40
40 -
 41
41 -
 42
42 -
 43
43 -
 44
44 -
 45
45 -
 46
46 -
 47
47 -
 48
48 -
 49
49 -
 50
50 -
 51
51 -
 52
52 -
 53
53 -
 54
54 -
 55
55 -
 56
56 -
 57
57 -
 58
58 -
 59
59 -
 60
60 -
61
-
62
-
63
-
64
-
65
-
66
-
67
-
68
-
69
-
70
-
71
-
72
-
73
-
74
-
75
-
76
-
77
-
78
 |
 |

The Procter & Gamble Company
48 Management’s Discussion and Analysis
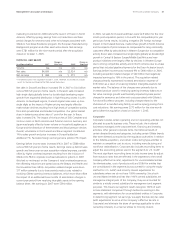
The following table provides a numerical reconciliation of organic sales
growth to reported net sales growth for scal 2006:
Total
Company Health Care
Reported net sales growth 20% 29%
Less: Acquisitions & divestitures impact -14% -21%
Less: Foreign exchange impact 1% 1%
7% 9%
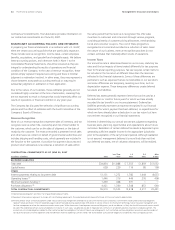
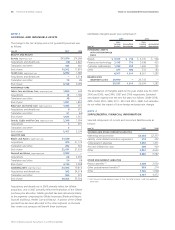
Free Cash Flow. Free cash ow is dened as operating cash ow less
capital spending. The Company views free cash ow as an important
measure because it is one factor in determining the amount of cash
available for dividends and discretionary investment. Free cash ow is
also one of the measures used to evaluate senior management and is
a factor in determining their at-risk compensation.
Free Cash Flow Productivity. Free cash ow productivity is dened as
the ratio of free cash ow to net earnings. The Company’s target is to
generate free cash ow at or above 90% of net earnings. Free cash
ow productivity is one of the measures used to evaluate senior
management and is a factor in determining their at-risk compensation.
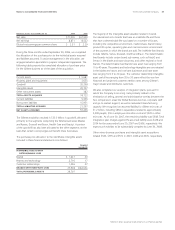
The following table provides a numerical reconciliation of free cash ow:
Free
Operating Capital Free Net Cash Flow
Cash Flow Spending Cash Flow Earnings Productivity
2006 11,375 (2,667) 8,708 8,684 100%
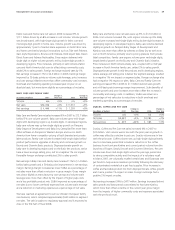
The following table provides a numerical reconciliation of organic sales
growth to reported net sales growth for scal 2007:
Fabric Baby
Total Care and Care and Blades
Company Beauty Health Care Home Care Family Care and Razors
Reported net sales growth 12% 9% 14% 11% 6% 49%
Less: Acquisitions & divestitures impact -5% -1% -6% 0% 0% -37%
Less: Foreign exchange impact -2% -3% -2% -3% -2% -4%
5% 5% 6% 8% 4% 8%