Proctor and Gamble 2007 Annual Report Download - page 51
Download and view the complete annual report
Please find page 51 of the 2007 Proctor and Gamble annual report below. You can navigate through the pages in the report by either clicking on the pages listed below, or by using the keyword search tool below to find specific information within the annual report.-
 1
1 -
2
-
3
-
4
-
5
-
6
-
7
-
8
-
9
-
10
-
11
-
12
-
13
-
14
-
15
-
16
-
17
-
18
-
19
-
20
-
21
-
22
-
23
-
24
-
25
-
26
-
27
-
28
-
29
-
30
-
31
-
32
-
33
-
34
-
35
-
36
-
37
-
38
-
39
-
40
-
 41
41 -
 42
42 -
 43
43 -
 44
44 -
 45
45 -
 46
46 -
 47
47 -
 48
48 -
 49
49 -
 50
50 -
 51
51 -
 52
52 -
 53
53 -
 54
54 -
 55
55 -
 56
56 -
 57
57 -
 58
58 -
 59
59 -
 60
60 -
 61
61 -
62
-
63
-
64
-
65
-
66
-
67
-
68
-
69
-
70
-
71
-
72
-
73
-
74
-
75
-
76
-
77
-
78
 |
 |
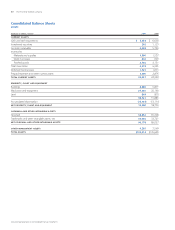
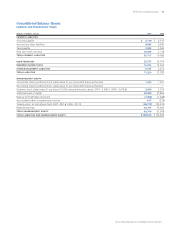
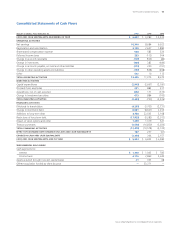
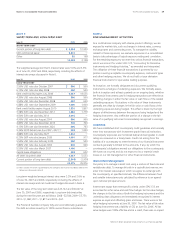
The Procter & Gamble Company 49
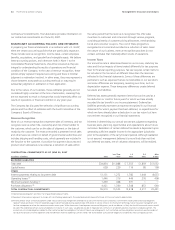
See accompanying Notes to Consolidated Financial Statements.
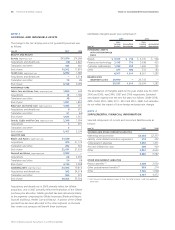
Amounts in millions except per share amounts; Years ended June 30 2006 2005
$68,222 $56,741
Cost of products sold 33,125 27,872
Selling, general and administrative expense 21,848 18,400
13,249 10,469
Interest expense 1,119 834
Other non-operating income, net 283 346
12,413 9,981
Income taxes 3,729 3,058
$ 8,684 $ 6,923
$ 2.79 $ 2.70
$ 2.64 $ 2.53
$ 1.15 $ 1.03