Proctor and Gamble 2007 Annual Report Download - page 63
Download and view the complete annual report
Please find page 63 of the 2007 Proctor and Gamble annual report below. You can navigate through the pages in the report by either clicking on the pages listed below, or by using the keyword search tool below to find specific information within the annual report.-
 1
1 -
2
-
3
-
4
-
5
-
6
-
7
-
8
-
9
-
10
-
11
-
12
-
13
-
14
-
15
-
16
-
17
-
18
-
19
-
20
-
21
-
22
-
23
-
24
-
25
-
26
-
27
-
28
-
29
-
30
-
31
-
32
-
33
-
34
-
35
-
36
-
37
-
38
-
39
-
40
-
41
-
42
-
43
-
44
-
45
-
46
-
47
-
48
-
49
-
50
-
51
-
52
-
 53
53 -
 54
54 -
 55
55 -
 56
56 -
 57
57 -
 58
58 -
 59
59 -
 60
60 -
 61
61 -
 62
62 -
 63
63 -
 64
64 -
 65
65 -
 66
66 -
 67
67 -
 68
68 -
 69
69 -
 70
70 -
 71
71 -
 72
72 -
 73
73 -
74
-
75
-
76
-
77
-
78
 |
 |

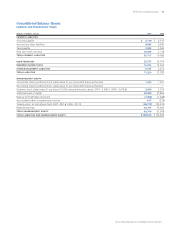
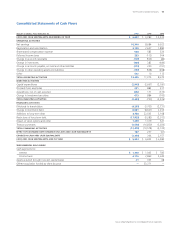
Millions of dollars except per share amounts or as otherwise specied.
Notes to Consolidated Financial Statements The Procter & Gamble Company 61
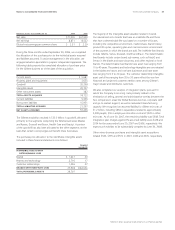
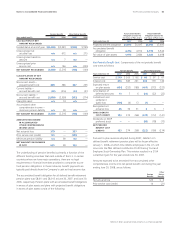
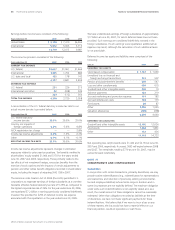
Shares in millions; Years ended June 30 2006 2005
Basic weighted average common
shares outstanding 3,054.9 2,515.6
Effect of dilutive securities
Conversion of preferred shares (1) 154.1 158.3
Exercise of stock options and
other unvested equity awards (2) 76.9 63.2
3,285.9 2,737.1
(1) Despite being included currently in diluted net earnings per common share, the actual conversion
to common stock occurs pursuant to the repayment of the ESOPs’ obligations through 2035.
(2) Approximately 41 million in 2007, 44 million in 2006 and 48 million in 2005 of the Company’s
outstanding stock options were not included in the diluted net earnings per share calculation
because to do so would have been antidilutive (i.e., the total proceeds upon exercise would
have exceeded the market value of the underlying common shares).
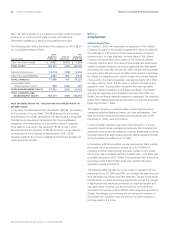
NOTE 8
We have a primary stock-based compensation plan under which
stock options are granted annually to key managers and directors
with exercise prices equal to the market price of the underlying shares
on the date of grant. A total of 229 million shares of common stock
were authorized for issuance under plans approved by shareholders
in 2001 and 2003, of which 73 million remain available for grant.
An additional 20 million shares of common stock were authorized for
issuance under a plan approved by Gillette shareowners in 2004 and
assumed by the Company in conjunction with the acquisition of
The Gillette Company in October 2005. A total of 14 million of the
shares remain available for grant under this plan. There are also ve
million shares available for grant under the Future Shares Plan
approved by the Board of Directors in 1997. This plan will terminate
in October 2007. Grants issued under P&G shareholder approved
plans since September 2002 are vested after three years and have a
10-year life. Grants issued under these plans from July 1998 through
August 2002 are vested after three years and have a 15-year life,
while grants issued prior to July 1998 are vested after one year and
have a 10-year life. In addition to our key manager and director
grants, we make other minor stock option grants to employees for
which vesting terms and option lives are not substantially different.
Total stock-based compensation expense for stock option grants
was $612, $526 and $459 for 2007, 2006 and 2005, respectively.
The total income tax benet recognized in the income statement for
these stock-based compensation arrangements was $163, $140 and
$125 for 2007, 2006 and 2005, respectively. We also make minor
grants of restricted stock, restricted stock units and other stock-based
grants to certain employees. Total compensation cost for these
restricted stock, restricted stock units and other stock-based grants,
which are generally expensed at grant date, was $56, $59 and $65 in
2007, 2006 and 2005, respectively.
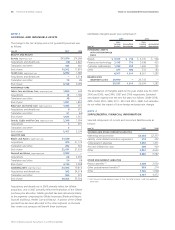
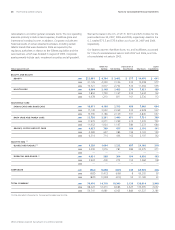
In calculating the compensation expense for options granted, we
estimated the fair value of each grant issued through December 31,
2004, using the Black-Scholes option-pricing model. Effective January 1,
2005, we utilize a binomial lattice-based model for the valuation of
stock option grants. The utilization of the binomial lattice-based model
did not have a signicant impact on the valuation of stock options as
compared to the Black-Scholes model. Assumptions utilized in the
model, which are evaluated and revised, as necessary, to reect market
conditions and experience, were as follows:
Years ended June 30 2006 2005
Interest rate 4.5% – 4.7% 3.2% – 4.5%
Weighted average
interest rate 4.6% 4.4%
Dividend yield 1.9% 1.9%
Expected volatility 15% – 20% 15% – 20%
Weighted average
volatility 19% 20%
Expected life in years 9 9
Because lattice-based option valuation models incorporate ranges of
assumptions for inputs, those ranges are disclosed in the preceding
table. Expected volatilities are based on a combination of historical
volatility of our stock and implied volatilities of call options on our
stock. We use historical data to estimate option exercise and employee
termination patterns within the valuation model. The expected term
of options granted is derived from the output of the option valuation
model and represents the average period of time that options
granted are expected to be outstanding. The interest rate for periods
within the contractual life of the options is based on the U.S. Treasury
yield curve in effect at the time of grant.
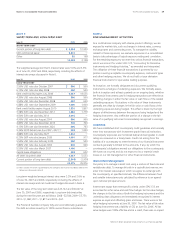
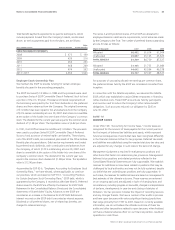
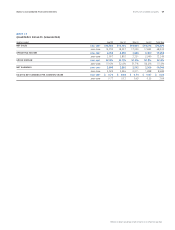
A summary of options under the plans as of June 30, 2007, and
activity during the year then ended is presented below:
Weighted Avg.
Remaining Aggregate
Weighted Avg. Contractual Intrinsic Value
Options in thousands Options Exercise Price Life in Years (in millions)
Outstanding,
beginning of year 362,352 $43.71
Granted 33,091 63.33
Exercised (37,658) 37.77
Canceled (2,779) 51.66
355,006 46.10 7.5 $5,424
257,171 41.22 7.0 5,132
The weighted average grant-date fair value of options granted was
$17.29, $16.30 and $14.34 per share in 2007, 2006 and 2005,
respectively. The total intrinsic value of options exercised was $894,
$815 and $526 in 2007, 2006 and 2005, respectively. The total
grant-date fair value of options that vested during 2007, 2006 and
2005 was $552, $388 and $532, respectively. We have no specic
policy to repurchase common shares to mitigate the dilutive impact of
options; however, we have historically made adequate discretionary
purchases, based on cash availability, market trends and other factors,
to satisfy stock option exercise activity.