Proctor and Gamble 2007 Annual Report Download - page 39
Download and view the complete annual report
Please find page 39 of the 2007 Proctor and Gamble annual report below. You can navigate through the pages in the report by either clicking on the pages listed below, or by using the keyword search tool below to find specific information within the annual report.-
 1
1 -
2
-
3
-
4
-
5
-
6
-
7
-
8
-
9
-
10
-
11
-
12
-
13
-
14
-
15
-
16
-
17
-
18
-
19
-
20
-
21
-
22
-
23
-
24
-
25
-
26
-
27
-
28
-
 29
29 -
 30
30 -
 31
31 -
 32
32 -
 33
33 -
 34
34 -
 35
35 -
 36
36 -
 37
37 -
 38
38 -
 39
39 -
 40
40 -
 41
41 -
 42
42 -
 43
43 -
 44
44 -
 45
45 -
 46
46 -
 47
47 -
 48
48 -
 49
49 -
50
-
51
-
52
-
53
-
54
-
55
-
56
-
57
-
58
-
59
-
60
-
61
-
62
-
63
-
64
-
65
-
66
-
67
-
68
-
69
-
70
-
71
-
72
-
73
-
74
-
75
-
76
-
77
-
78
 |
 |

The Procter & Gamble Company 37Management’s Discussion and Analysis
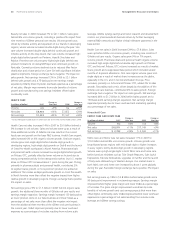
Volume
Volume with Excluding
Acquisitions Acquisitions Foreign Net Sales
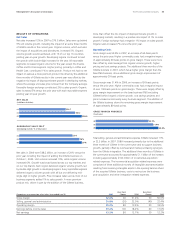
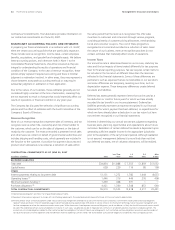
Net Sales Change Drivers vs. Year Ago (2007 vs. 2006) & Divestitures & Divestitures Exchange Price Mix/Other Growth
Beauty 5% 5% 3% 0% 1% 9%
Health Care 9% 4% 2% 2% 1% 14%
Fabric Care and Home Care 8% 8% 3% 0% 0% 11%
Baby Care and Family Care 5% 5% 2% 0% -1% 6%
Snacks, Coffee and Pet Care 0% 0% 2% 1% 1% 4%
Blades and Razors n/a n/a n/a n/a n/a n/a
Duracell and Braun n/a n/a n/a n/a n/a n/a
9% 5% 2% 1% 0% 12%
Sales percentage changes are approximations based on quantitative formulas that are consistently applied.
Results for the segments reect information on the same basis we
use for internal management reporting and performance evaluation.
Within the Beauty and Health GBU, we provide data for the Beauty
and the Health Care reportable segments. In the Household Care
GBU, we provide data for the Fabric Care and Home Care, the Baby
Care and Family Care and the Snacks, Coffee and Pet Care reportable
segments. In the Gillette GBU, we provide data for the Blades and
Razors and the Duracell and Braun reportable segments.
The results of these reportable business segments do not include
certain non-business unit specic costs such as interest expense,
investing activities and certain restructuring costs. These costs are
reported in our Corporate segment and are discussed below as part
of our Corporate segment discussion. Additionally, as described in
Note 12 to the Consolidated Financial Statements, we have investments
in certain companies over which we exert signicant inuence, but
do not control the nancial and operating decisions and, therefore,
do not consolidate them (“unconsolidated entities”). Since certain of
these investments are managed as integral parts of the Company’s
business units, they are accounted for as if they were consolidated
subsidiaries for management and segment reporting purposes. This
means pretax earnings in the business units include 100% of each
pretax income statement component. In determining after-tax earnings
in the business units, we eliminate the share of earnings applicable to
other ownership interests, in a manner similar to minority interest,
and apply the statutory tax rates. Eliminations to adjust each line item
to U.S. GAAP are included in our Corporate segment.
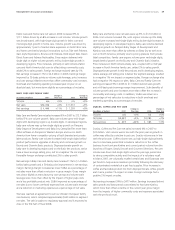
Change vs. Change vs.
(in millions of dollars) Prior Year* 2006* Prior Year*
Volume +5% n/a +8%
Net sales +9% $21,126 +7%
Net earnings +12% $ 3,106 +13%
* Fiscal 2006 gures include results of Gillette personal care for the nine months ended
June 30, 2006.
Beauty net sales increased 9% to $23.0 billion in 2007, behind 5%
unit volume growth. Volume growth was driven by initiative activity
across categories and continued expansion in developing regions,
where volume increased double-digits. Prestige fragrances volume was
up double-digits behind The One, Boss Selection and Boss Femme
fragrance initiatives and the addition of Dolce & Gabbana. Skin care
volume was up high-single digits behind the Olay Denity and Regenerist
product initiatives. Feminine care volume was up high-single digits,
led by double-digit growth in developing regions. Successful initiative
activity in North America on the Always Clean and Fresh initiatives
and product upgrades on Tampax Pearl more than offset the impact
of strong competitive activity in Western Europe and Northeast Asia,
resulting in a 1 point increase in our global feminine care market
share. Hair care volume grew mid-single digits as a result of product
initiatives on Pantene, Head & Shoulders and Herbal Essences and
continued expansion in developing regions. Beauty sales beneted from
a 1% positive mix impact primarily due to disproportionate growth in
prestige fragrances, which has a higher than segment average unit
selling price. Favorable foreign exchange contributed an additional 3%
to sales. Organic sales were up 5%, including a negative 1% impact
from the sales disruption in Asia resulting from the voluntary temporary
suspension of SK-II shipments in China early in the scal year.
Net earnings increased 12% in 2007 to $3.5 billion behind sales
growth and earnings margin improvement. Earnings margin increased
50-basis points primarily due to lower SG&A as a percentage of net
sales and divestiture gains on several minor Beauty brands, partially
offset by the negative mix impact from the SK-II disruption. SG&A
improved as higher marketing spending as a percentage of net sales
to support initiative activity was more than offset by lower overhead
expenses as a percentage of net sales resulting from volume scale
leverage and Gillette-related synergy savings.