Proctor and Gamble 2007 Annual Report Download - page 2
Download and view the complete annual report
Please find page 2 of the 2007 Proctor and Gamble annual report below. You can navigate through the pages in the report by either clicking on the pages listed below, or by using the keyword search tool below to find specific information within the annual report.-
 1
1 -
 2
2 -
 3
3 -
 4
4 -
 5
5 -
 6
6 -
 7
7 -
 8
8 -
 9
9 -
 10
10 -
 11
11 -
 12
12 -
 13
13 -
14
-
15
-
16
-
17
-
18
-
19
-
20
-
21
-
22
-
23
-
24
-
25
-
26
-
27
-
28
-
29
-
30
-
31
-
32
-
33
-
34
-
35
-
36
-
37
-
38
-
39
-
40
-
41
-
42
-
43
-
44
-
45
-
46
-
47
-
48
-
49
-
50
-
51
-
52
-
53
-
54
-
55
-
56
-
57
-
58
-
59
-
60
-
61
-
62
-
63
-
64
-
65
-
66
-
67
-
68
-
69
-
70
-
71
-
72
-
73
-
74
-
75
-
76
-
77
-
78
 |
 |

Letter to Shareholders 2
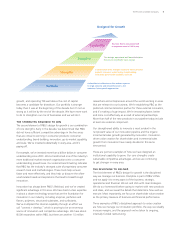
Designed to Grow 8
Designed to Win 14
Designed to Deliver 18
Designed to Lead 22
Financial Contents 27
Corporate Ofcers 70
Board of Directors 71
Shareholder Information 72
11-Year Financial Summary 73
P&G at a Glance 74
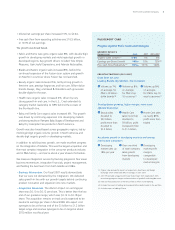
Amounts in millions, except per share amounts 2006 2005 2004 2003
Net Sales $68,222 $56,741 $51,407 $43,377
Operating Income 13,249 10,469 9,382 7,312
Net Earnings 8,684 6,923 6,156 4,788
Net Earnings Margin 12.7% 12.2% 12.0% 11.0%
Basic Net Earnings Per Common Share $ 2.79 $ 2.70 $ 2.34 $ 1.80
Diluted Net Earnings Per Common Share 2.64 2.53 2.20 1.70
Dividends Per Common Share 1.15 1.03 0.93 0.82
C:IH6A:H
^cW^aa^dchd[YdaaVgh
)(#)
,+#*
*&#)
*+#,
+-#'
%(
%)
%*
%,
%+
DE:G6I>C<86H=;ADL
^cW^aa^dchd[YdaaVgh
-#,
&(#)
.#)
-#,
&&#)
%(
%)
%*
%,
%+
9>AJI:9C:I:6GC>C<H
eZgXdbbdch]VgZ
&#,%
(#%)
'#'%
'#*(
'#+)
%(
%)
%*
%,
%+