Proctor and Gamble 2001 Annual Report Download - page 37
Download and view the complete annual report
Please find page 37 of the 2001 Proctor and Gamble annual report below. You can navigate through the pages in the report by either clicking on the pages listed below, or by using the keyword search tool below to find specific information within the annual report.-
 1
1 -
2
-
3
-
4
-
5
-
6
-
7
-
8
-
9
-
10
-
11
-
12
-
13
-
14
-
15
-
16
-
17
-
18
-
19
-
20
-
21
-
22
-
23
-
24
-
25
-
26
-
 27
27 -
 28
28 -
 29
29 -
 30
30 -
 31
31 -
 32
32 -
 33
33 -
 34
34 -
 35
35 -
 36
36 -
 37
37 -
 38
38 -
 39
39 -
 40
40
 |
 |

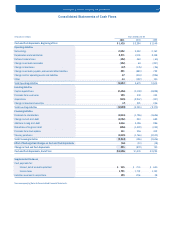
The Procter & Gamble Company and Subsidiaries 35
Notes to Consolidated Financial Statements (continued)
Millions of dollars except per share amounts
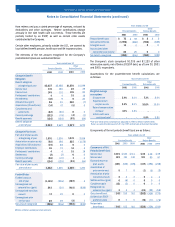
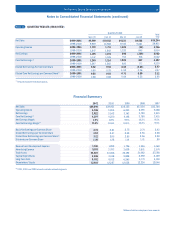
NOTE 13 QUARTERLY RESULTS (UNAUDITED)
Financial Summary
$39,244
39,951
4,736
5,954
2,922
3,542
4,397
4,230
2.07
2.47
3.12
2.95
Net Sales
Operating Income
Net Earnings
Core Net Earnings(1)
Diluted Net Earnings Per Common Share
Diluted Core Net Earnings per Common Share(1)
2000–2001
1999–2000
2000–2001
1999–2000
2000–2001
1999–2000
2000–2001
1999–2000
2000–2001
1999–2000
2000–2001
1999–2000
$9,969
9,919
1,779
1,847
1,155
1,147
1,240
1,267
0.82
0.80
0.88
0.88
$10,182
10,588
1,711
1,842
1,194
1,126
1,314
1,263
0.84
0.78
0.93
0.88
$9,511
9,783
1,302
1,320
893
753
1,006
923
0.63
0 .52
0.71
0.64
$9,582
9,661
56
945
320
516
837
777
0.23
0.36
0.60
0.55
( )
( )
( )
Quarters Ended
Sept. 30 Dec. 31 Mar. 31 June 30
(1)Amounts exclude restructuring costs.
Total
Year
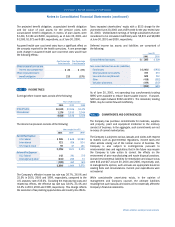
$39,244
4,736
2,922
4,397
7.4%
11.2%
2.15
2.07
3.12
1.40
1,769
3,193
34,387
2,486
9,792
12,010
Net Sales
Operating Income
Net Earnings
Core Net Earnings(2)
Net Earnings Margin
Core Net Earnings Margin(2)
Basic Net Earnings per Common Share
Diluted Net Earnings per Common Share
Diluted Core Net Earnings per Common Share(2)
Dividends per Common Share
Research and Development Expense
Advertising Expense
Total Assets
Capital Expenditures
Long-Term Debt
Shareholders’ Equity
(2) 2001, 2000 and 1999 amounts exclude restructuring costs.
$39,951
5,954
3,542
4,230
8.9%
10.6%
2.61
2.47
2.95
1.28
1,899
3,793
34,366
3,018
9,012
12,287
$38,125
6,253
3,763
4,148
9.9%
10.9%
2.75
2.59
2.85
1.14
1,726
3,639
32,192
2,828
6,265
12,058
$37,154
6,055
3,780
3,780
10.2%
10.2%
2.74
2.56
2.56
1.01
1,546
3,801
31,042
2,559
5,774
12,236
$35,764
5,488
3,415
3,415
9.5%
9.5%
2.43
2.28
2.28
.90
1,469
3,574
27,598
2,129
4,159
12,046
2001 2000 1999 1998 1997