Proctor and Gamble 2001 Annual Report Download - page 15
Download and view the complete annual report
Please find page 15 of the 2001 Proctor and Gamble annual report below. You can navigate through the pages in the report by either clicking on the pages listed below, or by using the keyword search tool below to find specific information within the annual report.-
 1
1 -
2
-
3
-
4
-
 5
5 -
 6
6 -
 7
7 -
 8
8 -
 9
9 -
 10
10 -
 11
11 -
 12
12 -
 13
13 -
 14
14 -
 15
15 -
 16
16 -
 17
17 -
 18
18 -
 19
19 -
 20
20 -
 21
21 -
 22
22 -
 23
23 -
 24
24 -
 25
25 -
26
-
27
-
28
-
29
-
30
-
31
-
32
-
33
-
34
-
35
-
36
-
37
-
38
-
39
-
40
 |
 |

FABRIC AND HOME CARE
Fabric and home care trends reflect the significant effort to restore
historical margins through innovation combined with necessary
pricing, disciplined cost focus and more efficient marketing. Net
sales were $11.66 billion, down 4% versus a strong year ago base
which included new brand introductions. Excluding a 3%
unfavorable foreign exchange impact, net sales decreased 1%. Unit
volume decreased 2% due to heavy competitive activity, primarily in
Western Europe.
Despite the volume decline, net earnings increased 13% to $1.64
billion. Net earnings growth was significant in light of product cost
increases and exchange impacts, which were offset by the benefits
of laundry pricing actions and lower taxes. Latin America delivered
particularly strong earnings progress, reflecting disciplined cost
management.
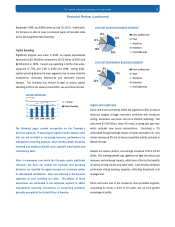
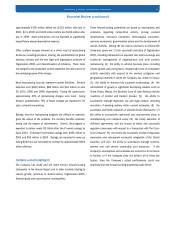
Fabric and home care is the Company’s most profitable segment,
accounting for nearly a third of net sales and an even greater
percentage of profits.
September 1999, was $489 million at June 30, 2001. Additionally,
the Company is able to issue commercial paper at favorable rates
and to access general bank financing.
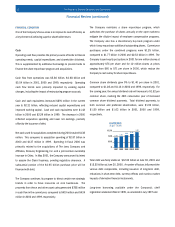
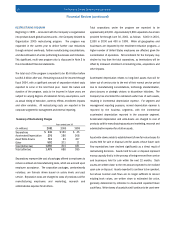
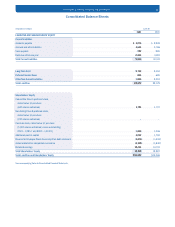
Capital Spending
Significant progress was made in 2001, as capital expenditures
decreased to $2.49 billion compared to $3.02 billion in 2000 and
$2.83 billion in 1999. Current year spending is 6.3% of net sales,
compared to 7.6% and 7.4% in 2000 and 1999. During 2001,
capital spending declined in most segments due to more choiceful
investments, increased efficiencies and favorable currency
impacts. The Company has revised its goal to reduce capital
spending to 6% of net sales by fiscal 2003, one year ahead of plan.
The following pages provide perspective on the Company’s
business segments. Product-based segment results exclude items
that are not included in measuring business performance for
management reporting purposes, most notably certain financing,
investing and employee benefit costs, goodwill amortization and
restructuring costs.
Sales in companies over which the Company exerts significant
influence, but does not control the financial and operating
decisions, are reported for segment purposes in a manner similar
to consolidated subsidiaries. Taxes are reflected in the business
segments at local statutory tax rates. The effects of these
conventions are eliminated in the corporate segment to adjust
management reporting conventions to accounting principles
generally accepted in the United States of America.
The Procter & Gamble Company and Subsidiaries 13
Financial Review (continued)
CAPITAL SPENDING
(in billions)
1997
Capital Spending
0
1
2
3
$4
0%
2%
4%
6%
8%
1998 1999 2000 2001
% of Sales
Fabric and Home Care
Beauty Care
Health Care
Food and Beverage
Paper
2001 NET SALES BY BUSINESS SEGMENT
11 %
30%
11 %
18%
30%
Fabric and Home Care
Beauty Care
Health Care
Food and Beverage
Paper
8%
37%
9%
22%
24%
2001 NET EARNINGS BY BUSINESS SEGMENT