Proctor and Gamble 2001 Annual Report Download - page 13
Download and view the complete annual report
Please find page 13 of the 2001 Proctor and Gamble annual report below. You can navigate through the pages in the report by either clicking on the pages listed below, or by using the keyword search tool below to find specific information within the annual report.-
 1
1 -
2
-
 3
3 -
 4
4 -
 5
5 -
 6
6 -
 7
7 -
 8
8 -
 9
9 -
 10
10 -
 11
11 -
 12
12 -
 13
13 -
 14
14 -
 15
15 -
 16
16 -
 17
17 -
 18
18 -
 19
19 -
 20
20 -
 21
21 -
 22
22 -
 23
23 -
24
-
25
-
26
-
27
-
28
-
29
-
30
-
31
-
32
-
33
-
34
-
35
-
36
-
37
-
38
-
39
-
40
 |
 |

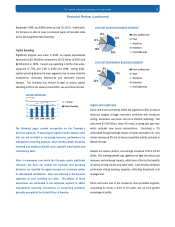
Excluding these charges, gross margin was 46.8%, 47.4% and
46.0% in 2001, 2000 and 1999, respectively, reflecting rising
material costs despite the benefit of pricing actions and effective
cost management.
Operating margin was 12.1%, compared to 14.9% in 2000 and
16.4% in 1999. Excluding restructuring charges, core operating
margin was 16.7%, compared to 16.9% in 2000 and 17.7% in
1999.
Net earnings margin was 7.4% versus 8.9% in 2000 and 9.9% in
1999. Excluding restructuring charges, core net earnings margin
was 11.2%, up from 10.6% in 2000 and 10.9% in 1999. The margin
increase in 2001 reflects the gains from minor brand divestitures
and lower taxes, partially offset by increased product costs and
unfavorable exchange impacts. In 2000, the core net earnings
margin decreased, reflecting increased spending, primarily from
initiative investments.
Non-Operating Items
Interest expense was $794 million in 2001, compared to $722
million in 2000 and $650 million in 1999. The interest expense
trend reflects higher average debt levels, primarily due to share
repurchases and acquisitions.
Other income, net, which consists primarily of interest and
investment income and divestiture gains contributed $674 million,
compared to $304 million in 2000 and $235 million in 1999.
Increased gains from the divestiture of minor brands drove the year-
to-year changes.
The Company’s effective tax rate for the current year was 36.7%,
compared to 36.0% in 2000 and 35.5% in 1999. Excluding
restructuring costs and related tax effects, the effective tax rate was
32.0%, compared to 33.4% in 2000 and 34.4% in 1999. This
change reflects the continuing benefit of the implementation of the
Company’s new global business unit structure.
Operating Costs
Consistent with its commitment to reduce its cost structure to more
competitive levels, in the fourth quarter, the Company broadened its
restructuring program to deliver further cost reductions by reducing
overheads, consolidating manufacturing operations and addressing
under-performing businesses and initiatives. Given the nature and
magnitude of the charges related to this program, the following
discussions include supplemental information on a “core” basis –
excluding restructuring charges.
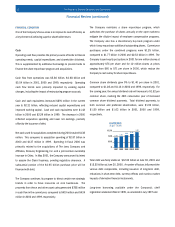
Cost of products sold was $22.10 billion in 2001, compared to
$21.51 billion and $21.03 billion in 2000 and 1999, respectively.
Restructuring costs included in cost of products sold were $1.14
billion in 2001, $496 million in 2000 and $443 million in 1999.
Excluding restructuring charges, cost of products sold was flat versus
the prior year, as a disciplined cost focus overcame commodity cost
increases, such as energy. Core cost of products sold was up 2%
in 2000.
Marketing, research and administrative expense was $12.41 billion
versus $12.48 billion in 2000 and $10.85 billion in 1999. These
include restructuring costs of $583 million in 2001, $318 million in
2000 and $38 million in 1999, primarily due to employee
separation expenses. Excluding restructuring charges, marketing,
research and administrative expense was $11.82 billion in the
current year versus $12.17 billion in 2000 and $10.81 billion in
1999. As a percent of net sales, this was 30.0% in 2001, 30.4% in
2000 and 28.3% in 1999. The decrease in the current year was due
to a reduction in overhead costs, as well as marketing support
efficiencies. The increase in 2000 reflects the high level of initiative
investment.
Margins
In 2001, gross margin was 43.7%, compared to 46.1% in 2000 and
44.8% in 1999. Gross margin included restructuring charges that
consisted primarily of accelerated depreciation, asset write-downs
and employee separation costs for manufacturing employees.
The Procter & Gamble Company and Subsidiaries 11
Financial Review (continued)