Proctor and Gamble 2001 Annual Report Download - page 27
Download and view the complete annual report
Please find page 27 of the 2001 Proctor and Gamble annual report below. You can navigate through the pages in the report by either clicking on the pages listed below, or by using the keyword search tool below to find specific information within the annual report.-
 1
1 -
2
-
3
-
4
-
5
-
6
-
7
-
8
-
9
-
10
-
11
-
12
-
13
-
14
-
15
-
16
-
 17
17 -
 18
18 -
 19
19 -
 20
20 -
 21
21 -
 22
22 -
 23
23 -
 24
24 -
 25
25 -
 26
26 -
 27
27 -
 28
28 -
 29
29 -
 30
30 -
 31
31 -
 32
32 -
 33
33 -
 34
34 -
 35
35 -
 36
36 -
 37
37 -
38
-
39
-
40
 |
 |

$ 1,549
3,763
2,148
60
207
96
792
926
130
5,544
2,828
434
137
356
2,175
1,626
689
986
334
212
2,533
2,606
18
745
$ 2,294
$ 640
1,743
38
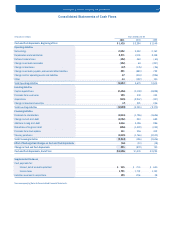
Years ended June 30
Amounts in millions
Cash and Cash Equivalents, Beginning of Year
Operating Activities
Net earnings
Depreciation and amortization
Deferred income taxes
Change in accounts receivable
Change in inventories
Change in accounts payable, accrued and other liabilities
Change in other operating assets and liabilities
Other
Total Operating Activities
Investing Activities
Capital expenditures
Proceeds from asset sales
Acquisitions
Change in investment securities
Total Investing Activities
Financing Activities
Dividends to shareholders
Change in short-term debt
Additions to long-term debt
Reductions of long-term debt
Proceeds from stock options
Treasury purchases
Total Financing Activities
Effect of Exchange Rate Changes on Cash and Cash Equivalents
Change in Cash and Cash Equivalents
Cash and Cash Equivalents, End of Year
Supplemental Disclosure
Cash payments for:
Interest, net of amount capitalized
Income taxes
Liabilities assumed in acquisitions
See accompanying Notes to Consolidated Financial Statements.
$ 2,294
3,542
2,191
463
64
176
883
404
122
4,675
3,018
419
2,967
221
5,345
1,796
243
4,196
1,409
336
1,766
196
13
879
$ 1,415
$ 700
1,712
236
$ 1,415
2,922
2,271
102
122
67
801
57
44
5,804
2,486
788
138
7
1,843
1,943
1,092
1,356
226
141
1,250
3,014
56
891
$ 2,306
$ 735
1,701
108
2001 2000 1999
( )
( )
( )
( )
( )
( )
( )
( )
( )
( )
( )
( )
( )
( )
( )
( )
( )
( )
( )
( )
( )
( )
( )
( )
( )
( )
( )
( )
( )
( )
( )
( )
( )
( )
( )
( )
( )
( )
Consolidated Statements of Cash Flows
The Procter & Gamble Company and Subsidiaries 25