Proctor and Gamble 2001 Annual Report Download - page 30
Download and view the complete annual report
Please find page 30 of the 2001 Proctor and Gamble annual report below. You can navigate through the pages in the report by either clicking on the pages listed below, or by using the keyword search tool below to find specific information within the annual report.-
 1
1 -
2
-
3
-
4
-
5
-
6
-
7
-
8
-
9
-
10
-
11
-
12
-
13
-
14
-
15
-
16
-
17
-
18
-
19
-
 20
20 -
 21
21 -
 22
22 -
 23
23 -
 24
24 -
 25
25 -
 26
26 -
 27
27 -
 28
28 -
 29
29 -
 30
30 -
 31
31 -
 32
32 -
 33
33 -
 34
34 -
 35
35 -
 36
36 -
 37
37 -
 38
38 -
 39
39 -
 40
40
 |
 |

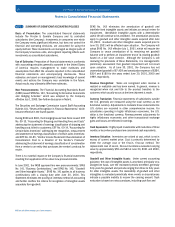
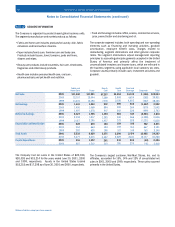
Millions of dollars except per share amounts
Selected Operating Expenses
Research and development costs are charged to earnings as
incurred and were $1,769 in 2001, $1,899 in 2000 and $1,726 in
1999. Advertising costs are charged to earnings as incurred and
were $3,193 in 2001, $3,793 in 2000 and $3,639 in 1999.
Net Earnings Per Common Share
Net earnings less preferred dividends (net of related tax benefits)
are divided by the weighted average number of common shares
outstanding during the year to calculate basic net earnings
per common share. Diluted net earnings per common share
are calculated to give effect to stock options and convertible
preferred stock.
Basic and diluted net earnings per share are reconciled as follows:
Equity Put Options
During 2001 and 2000, the Company entered into equity put
options on its common stock. These agreements can be settled on
a physical or net-share basis at the Company’s option. The premium
received from the sale of the instruments is credited to equity and
reduces the Company’s cash outlay for share repurchases.
The 2001 options are equivalent to one million common shares, at
approximately $74 per share. They expire in the first quarter of
2002. The options entered into in 2000 were equivalent to 12
million common shares, at prices ranging from $60 to $71 per
share. They expired mostly unexercised in the second quarter
of 2001.
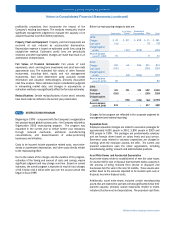
from such assets over their remaining useful lives were no longer
estimated to be greater than their current carrying values; therefore,
they were written down to estimated fair value, generally determined
by reference to discounted expected future cash flows. Such
charges represented approximately $160 before tax in 2001, $0 in
2000 and $160 in 1999.
Charges for accelerated depreciation are related to long-lived assets
that will be taken out of service prior to the end of their normal
service period due to manufacturing consolidations, technology
standardization, plant closures or strategic choices to discontinue
initiatives. The Company has shortened the estimated useful lives of
such assets, resulting in incremental depreciation expense.
Other Restructuring Charges
Other costs incurred as a direct result of the program included
relocation, training, establishment of global business services and
the new legal and organization structure of Organization 2005, and
discontinuation of initiatives.
NOTE 3 ACQUISITIONS
In 2001, acquisitions were accounted for using the purchase
method and totaled $246. These acquisitions resulted in goodwill
and other intangibles of $208. In 2000, the Company acquired The
Iams Company and Affiliates for approximately $2,222 in cash.
Other acquisitions in 2000 totaled $745 and consisted primarily of
Recovery Engineering, Inc. and a joint venture ownership increase in
China. The 2000 acquisitions were accounted for using the
purchase method and resulted in goodwill and other intangibles of
$2,508. Purchase acquisitions in 1999 totaled $137.
In May 2001, the Company announced its intent to purchase the
Clairol business from Bristol-Myers Squibb Company for $4,950.
The acquisition is subject to regulatory approvals.
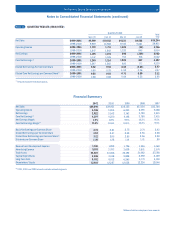
NOTE 4 SUPPLEMENTAL FINANCIAL INFORMATION
Notes to Consolidated Financial Statements (continued)
The Procter & Gamble Company and Subsidiaries
28
Years ended June 30
2001 2000 1999
Net earnings available to
common shareholders
Effect of dilutive securities
Preferred dividends, net
of tax benefit
Preferred dividend impact on
funding of ESOP
Diluted net earnings
$3,654
109
22
3,741
$3,427
115
18
3,524
$2,801
121
15
2,907
( )
( ) ( )
2001 2000 1999
Shares in millions
1,328.1
97.2
21.5
1,446.8
Basic weighted average common
shares outstanding
Effect of dilutive securities
Conversion of preferred shares
Exercise of stock options (1)
Diluted weighted average common
shares outstanding
1,313.2
94.3
19.7
1,427.2
1,300.3
91.9
13.4
1,405.6
Years ended June 30
(1)Approximately one-third of the Company’s outstanding stock options were not
included in the diluted net earnings per share calculation for 2001 because to do
so would have been antidilutive.
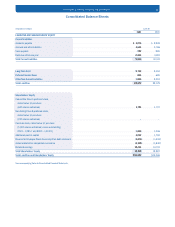
Accrued and Other Liabilities
Marketing expenses
Compensation expenses
Organization 2005 restructuring reserves
Other
Other Non-Current Liabilities
Other postretirement benefits
Pension benefits
Other
$1,142
462
88
2,074
3,766
$ 824
975
502
2,301
$1,271
576
460
2,324
4,631
$ 534
925
386
1,845
June 30
2001 2000