Proctor and Gamble 2001 Annual Report Download - page 34
Download and view the complete annual report
Please find page 34 of the 2001 Proctor and Gamble annual report below. You can navigate through the pages in the report by either clicking on the pages listed below, or by using the keyword search tool below to find specific information within the annual report.-
 1
1 -
2
-
3
-
4
-
5
-
6
-
7
-
8
-
9
-
10
-
11
-
12
-
13
-
14
-
15
-
16
-
17
-
18
-
19
-
20
-
21
-
22
-
23
-
 24
24 -
 25
25 -
 26
26 -
 27
27 -
 28
28 -
 29
29 -
 30
30 -
 31
31 -
 32
32 -
 33
33 -
 34
34 -
 35
35 -
 36
36 -
 37
37 -
 38
38 -
 39
39 -
 40
40
 |
 |

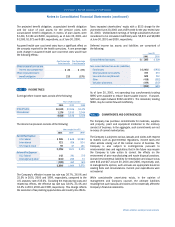
The Company’s stock comprised $1,335 and $1,123 of other
retiree plan assets, net of Series B ESOP debt, as of June 30, 2001
and 2000, respectively.
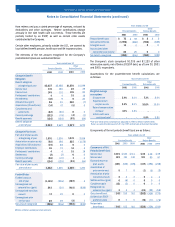
Assumptions for the postretirement benefit calculations are
as follows:
Components of the net periodic benefit cost are as follows:
from retirees and pay a stated percentage of expenses, reduced by
deductibles and other coverages. Retiree contributions change
annually in line with health care cost trends. These benefits are
partially funded by an ESOP, as well as certain other assets
contributed by the Company.
Certain other employees, primarily outside the U.S., are covered by
local defined benefit pension, health care and life insurance plans.
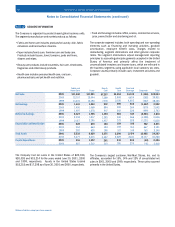
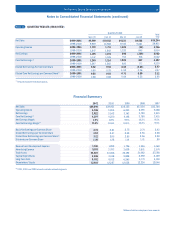
The elements of the net amount recognized for the Company’s
postretirement plans are summarized below:
The Procter & Gamble Company and Subsidiaries
32
Notes to Consolidated Financial Statements (continued)
2001 2000 1999
Years ended June 30
Pension Benefits
2001 2000 1999
Other
Retiree Benefits
$ 49
97
218
2
0
0
0
58
132
78
210
Components of Net
Periodic Benefit Cost
Service cost
Interest cost
Expected return on
plan assets
Amortization of
prior service cost
Amortization of prior
transition amount
Settlement loss (gain)
Curtailment gain
Recognized net
actuarial loss (gain)
Gross benefit cost
Dividends on ESOP
preferred stock
Net periodic
benefit cost
$ 120
151
122
7
4
6
3
4
155
0
155
$ 115
149
(127)
5
3
6
(13)
3
141
0
141
$ 40
101
317
1
0
0
0
85
262
76
338
$ 111
140
(105)
8
3
0
0
4
161
0
161
$ 39
90
294
2
0
0
0
92
259
77
336
( )
( )
( )
) ( )
( )
( )
( )
( )
( )
( )
( )
( )
( )
( )
( )
( )
( )
( )
( )
( )
( )
Millions of dollars except per share amounts
2001 2000
Weighted average
assumptions
Discount rate
Expected return
on plan assets
Rate of compensation
increase
Initial health care
cost trend rate*
Years ended June 30
6.1%
8.1%
4.5%
–
8.0%
10.0%
–
5.8%
5.9%
8.3%
4.1%
–
7.3%
10.0%
–
8.8%
Pension Benefits
2001 2000
Other
Retiree Benefits
*Five year trend rate assumption was adjusted in 2001 to reflect market trends.
Rate is assumed to decrease to 5.0% by 2007 and remain at that level thereafter.
$1,199
39
90
16
20
7
0
0
3
84
1,270
2,516
1,178
0
4
16
0
0
84
1,274
4
828
0
1
823
Years ended June 30
Other
Retiree Benefits
Pension Benefits
2001 2000
Change in Benefit
Obligation
Benefit obligation
at beginning of year
Service cost
Interest cost
Participants’ contributions
Amendments
Actuarial loss (gain)
Acquisitions/(Divestitures)
Curtailments and
settlements
Currency exchange
Benefit payments
Benefit obligation
at end of year
Change in Plan Assets
Fair value of plan assets
at beginning of year
Actual return on plan assets
Acquisitions/(Divestitures)
Employer contributions
Participants’ contributions
Settlements
Currency exchange
Benefit payments
Fair value of plan assets
at end of year
Funded Status
Funded status at
end of year
Unrecognized net
actuarial loss (gain)
Unrecognized transition
amount
Unrecognized prior
service cost
Net amount recognized
2001 2000
$2,488
120
151
4
9
35
47
20
79
128
2,627
1,555
198
28
73
4
2
37
128
1,691
936
30
21
39
906
$2,627
115
149
4
10
86
14
22
232
136
2,567
1,691
88
19
81
4
3
98
136
1,432
1,135
243
17
20
855
$1,270
40
101
18
0
250
5
0
4
93
1,577
1,274
235
0
14
18
0
1
93
1,449
128
418
0
8
554
( )
( )
( )
( )
( )
( )
( )
( )
( )
( )
( )
( )
( )
( )
( )
( )
( )
( )
( )
( )
( )
( )
( )
( )
( )
( )
( )
( )
( )
( )
( )
( )
( )
( )
( )
( )
Years ended June 30
Other
Retiree Benefits
Pension Benefits
2001 2000
2001 2000
Prepaid benefit cost
Accrued benefit cost
Intangible asset
Accumulated other
comprehensive income
Net liability recognized
$ 75
1,006
16
60
855
$ 59
990
0
25
906
$ 2
556
0
0
554
$ 2
825
0
0
823
( )
( )
( )
( )
( )
( )
( )
( )