Proctor and Gamble 2001 Annual Report Download - page 35
Download and view the complete annual report
Please find page 35 of the 2001 Proctor and Gamble annual report below. You can navigate through the pages in the report by either clicking on the pages listed below, or by using the keyword search tool below to find specific information within the annual report.-
 1
1 -
2
-
3
-
4
-
5
-
6
-
7
-
8
-
9
-
10
-
11
-
12
-
13
-
14
-
15
-
16
-
17
-
18
-
19
-
20
-
21
-
22
-
23
-
24
-
 25
25 -
 26
26 -
 27
27 -
 28
28 -
 29
29 -
 30
30 -
 31
31 -
 32
32 -
 33
33 -
 34
34 -
 35
35 -
 36
36 -
 37
37 -
 38
38 -
 39
39 -
 40
40
 |
 |

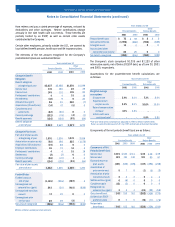
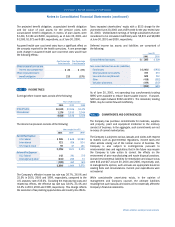
Taxes impacted shareholders’ equity with a $155 charge for the
year ended June 30, 2001 and a $59 credit for the year ended June
30, 2000. Undistributed earnings of foreign subsidiaries that are
considered to be reinvested indefinitely were $9,231 and $8,828
at June 30, 2001 and 2000, respectively.
Deferred income tax assets and liabilities are comprised of
the following:
As of June 30, 2001, net operating loss carryforwards totaling
$995 were available to reduce future taxable income. If unused,
$415 will expire between 2002 and 2011. The remainder, totaling
$580, may be carried forward indefinitely.
NOTE 11 COMMITMENTS AND CONTINGENCIES
The Company has purchase commitments for materials, supplies
and property, plant and equipment incidental to the ordinary
conduct of business. In the aggregate, such commitments are not
in excess of current market prices.
The Company is subject to various lawsuits and claims with respect
to matters such as governmental regulations, income taxes and
other actions arising out of the normal course of business. The
Company is also subject to contingencies pursuant to
environmental laws and regulations that in the future may require
the Company to take action to correct the effects on the
environment of prior manufacturing and waste disposal practices.
Accrued environmental liabilities for remediation and closure costs
were $43 and $47 at June 30, 2001 and 2000, respectively, and,
in management’s opinion, such accruals are appropriate based on
existing facts and circumstances. Current year expenditures were
not material.
While considerable uncertainty exists, in the opinion of
management and Company counsel, the ultimate liabilities
resulting from such lawsuits and claims will not materially affect the
Company’s financial statements.
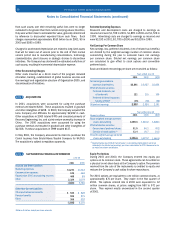
The projected benefit obligation, accumulated benefit obligation
and fair value of plan assets for the pension plans with
accumulated benefit obligations in excess of plan assets were
$1,414, $1,124 and $230, respectively, as of June 30, 2001, and
$1,368, $1,073 and $189, respectively, as of June 30, 2000.
Assumed health care cost trend rates have a significant effect on
the amounts reported for the health care plans. A one percentage
point change in assumed health care cost trend rates would have
the following effects:
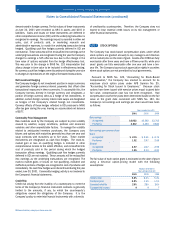
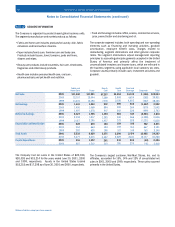
NOTE 10 INCOME TAXES
Earnings before income taxes consist of the following:
The income tax provision consists of the following:
The Company’s effective income tax rate was 36.7%, 36.0% and
35.5% in 2001, 2000 and 1999, respectively, compared to the
U.S. statutory rate of 35.0%. Excluding the restructuring costs and
related tax effects, the effective tax rate was 32.0%, 33.4% and
34.4% in 2001, 2000 and 1999, respectively. This change reflects
the execution of tax planning opportunities and country mix effects.
The Procter & Gamble Company and Subsidiaries 33
Notes to Consolidated Financial Statements (continued)
One Percentage
Point Increase
One Percentage
Point Decrease
Effect on total of service and
interest cost components
Effect on postretirement
benefit obligation
$(19)
(175)
$24
213
Years ended June 30
United States
International
$3,474
2,364
5,838
2001 2000 1999
$3,006
2,530
5,536
$3,340
1,276
4,616
Years ended June 30
2001 2000 1999
$1,080
934
121
2,135
74
14
60
2,075
Current Tax Expense
U.S. Federal
International
U.S. State & Local
Deferred Tax Expense
U.S. Federal
International & other
$ 648
816
67
1,531
241
222
463
1,994
$ 985
721
90
1,796
142
244
102
1,694
( )
( )
( )
( )
$ 309
$ 951
273
512
252
207
625
$ 397
$ 1,081
197
509
415
104
894
June 30
2001 2000
Current deferred tax assets
Non-current deferred tax assets (liabilities)
Fixed assets
Other postretirement benefits
Loss and other carryforwards
Other
Valuation allowances
( )
( )
( )
( )
( )
( )
( )
( )
Millions of dollars except per share amounts