Proctor and Gamble 2001 Annual Report Download - page 26
Download and view the complete annual report
Please find page 26 of the 2001 Proctor and Gamble annual report below. You can navigate through the pages in the report by either clicking on the pages listed below, or by using the keyword search tool below to find specific information within the annual report.-
 1
1 -
2
-
3
-
4
-
5
-
6
-
7
-
8
-
9
-
10
-
11
-
12
-
13
-
14
-
15
-
 16
16 -
 17
17 -
 18
18 -
 19
19 -
 20
20 -
 21
21 -
 22
22 -
 23
23 -
 24
24 -
 25
25 -
 26
26 -
 27
27 -
 28
28 -
 29
29 -
 30
30 -
 31
31 -
 32
32 -
 33
33 -
 34
34 -
 35
35 -
 36
36 -
37
-
38
-
39
-
40
 |
 |

24
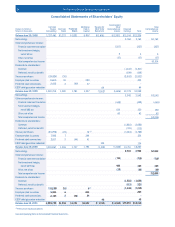
Consolidated Statements of Shareholders’ Equity
The Procter & Gamble Company and Subsidiaries
( )
( )
Net earnings
Other comprehensive income:
Financial statement translation
Net investment hedges,
net of $276 tax
Other, net of tax
Total comprehensive income
Dividends to shareholders:
Common
Preferred, net of tax benefit
Treasury purchases
Employee plan issuances
Preferred stock conversions
ESOP debt guarantee reduction
Balance June 30, 2001
Dollars in millions/
Shares in thousands
Common
Shares
Outstanding Common
Stock Preferred
Stock
Additional
Paid-In
Capital
Reserve for
ESOP Debt
Retirement
Accumulated
Other
Comprehensive
Income Retained
Earnings Total
Total
Comprehensive
Income
Balance June 30, 1998
Net earnings
Other comprehensive income:
Financial statement translation
Net investment hedges,
net of $4 tax
Other, net of tax
Total comprehensive income
Dividends to shareholders:
Common
Preferred, net of tax benefit
Treasury purchases
Employee plan issuances
Preferred stock conversions
ESOP debt guarantee reduction
Balance June 30, 1999
(1) Premium on equity put options.
See accompanying Notes to Consolidated Financial Statements.
$3,763
237
5
17
$3,514
Net earnings
Other comprehensive income:
Financial statement translation
Net investment hedges,
net of $88 tax
Other, net of tax
Total comprehensive income
Dividends to shareholders:
Common
Preferred, net of tax benefit
Treasury purchases
Employee plan issuances
Preferred stock conversions
ESOP debt guarantee reduction
Balance June 30, 2000
$3,542
449
150
63
$3,306
1,337,461
29,924
9,605
2,612
1,319,754
$1,337
30
10
3
1,320
$1,821
40
1,781
$ 907
393
37
1,337
$(1,616)
64
1,552
$(1,357)
237
5
17
1,606
449
150
63
1,842
$11,144
3,763
1,517
109
2,503
10,778
24,296
7,592
2,817
1,305,867
24
7
3
1,306
44
1,737
72
344
41
1,794
134
1,418
3,542
1,681
115
1,814
10,710
$2,922
715
460
23
$2,644
18,238
5,924
2,185
1,295,738
18
6
2
$1,296
36
$1,701
6
223
34
$2,057
43
$ 1,375
715
460
23
$ 2,120
2,922
1,822
121
1,238
$10,451
( )( )
(1)
(1)
( )
( )
( )
( ) ( )
( )
( )
( )
( )
( )
( )
( )
( )
( )( )
( )( )
( ) ( )
( )
( )
( )
( )
( )
( )
( )
( )
( )
( )
( )
3,542
449
150
63
1,681
115
1,766
351
–
134
12,287
2,922
715
460
23
1,822
121
1,250
229
–
43
$12,010
$12,236
3,763
237
5
17
1,517
109
2,533
403
–
64
12,058
( )
( )
( )
( )
( )
( )
( )
( )
( )
( )
( )
( )
( )
( )