Proctor and Gamble 2001 Annual Report Download - page 12
Download and view the complete annual report
Please find page 12 of the 2001 Proctor and Gamble annual report below. You can navigate through the pages in the report by either clicking on the pages listed below, or by using the keyword search tool below to find specific information within the annual report.-
 1
1 -
 2
2 -
 3
3 -
 4
4 -
 5
5 -
 6
6 -
 7
7 -
 8
8 -
 9
9 -
 10
10 -
 11
11 -
 12
12 -
 13
13 -
 14
14 -
 15
15 -
 16
16 -
 17
17 -
 18
18 -
 19
19 -
 20
20 -
 21
21 -
 22
22 -
23
-
24
-
25
-
26
-
27
-
28
-
29
-
30
-
31
-
32
-
33
-
34
-
35
-
36
-
37
-
38
-
39
-
40
 |
 |

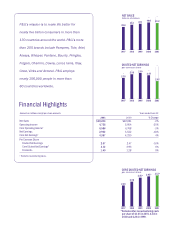
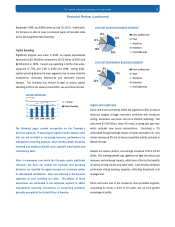
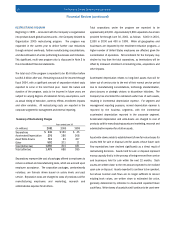
Core net earnings, which exclude restructuring program costs,
increased to $4.40 billion in 2001 from $4.23 billion in 2000 and
$4.15 billion in 1999. Core net earnings per share were $3.12,
compared to $2.95 per share in 2000 and $2.85 per share in 1999.
Core net earnings per share increased 6% in 2001, compared to 4%
in 2000. Core net earnings progress was significant in light of
product cost increases and exchange impacts, which were offset by
pricing benefits, lower taxes and gains from the divestiture of non-
strategic brands. Growth in the prior year was affected by significant
investments in new initiatives.
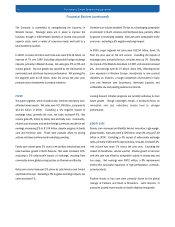
Net Sales
Reported net sales were $39.24 billion, compared to $39.95 billion
in 2000 and $38.13 billion in 1999. Excluding an unfavorable
exchange rate impact of over 3% in the current year, net sales grew
2%, reflecting improved pricing in beauty care, fabric and home care
and paper, primarily family care. Unit volume was flat in 2001, as
exceptionally strong performance by new businesses in health care
was offset by softness in food and beverage. Unit volume grew 4%
in 2000, while net sales excluding a 2% unfavorable exchange
impact increased 7%. This growth reflected strong product initiative
activity, the acquisition of the Iams pet health and nutrition business
and progress on flagship brands, largely in fabric and home care.
RESULTS OF OPERATIONS
Fiscal 2001 was a year of progress – in making choices, establishing
realistic goals and delivering on commitments. The Company also
made considerable progress on strengthening its cost structure and
improving cash efficiency. This was despite a tough year that
included weakening economies in some major geographies,
significant currency impacts, rising commodity prices and an
increasingly competitive environment.
To accelerate long-term growth, the Company has made and will
continue to make tough, clear choices about where to play and how
to win. The Company is focused on building superior shareholder
return – by creating and building big brands with top-line results,
sales margins and cash flow at the best competitive benchmarks.
During the past year, the Company refocused on its core categories
to develop high-margin growth businesses with global leadership
potential. The Company also expanded its restructuring program,
initiated in June 1999, in conjunction with Organization 2005, to
drive further enrollment reductions and address under-performing
businesses. These actions are critical to delivering on the
Company’s long-term goals to consistently grow earnings and
earnings per share at double-digit rates.
Net Earnings
Reported net earnings were $2.92 billion or $2.07 per share in
2001. This compared to $3.54 billion or $2.47 per share in 2000,
and $3.76 billion or $2.59 per share in 1999. Current year results
include charges of $1.48 billion after tax for restructuring program
costs. These costs were $688 million and $385 million in 2000 and
1999, respectively. This program covers a significant reduction in
enrollment, manufacturing consolidations and portfolio choices to
scale back or discontinue under-performing businesses and
initiatives.
The Procter & Gamble Company and Subsidiaries
10
Financial Review
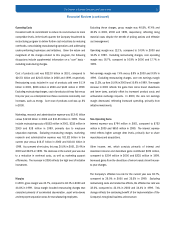
NET SALES AND EXCHANGE IMPACTS
(in billions)
1997
Foreign Exchange Impacts
32
34
36
38
40
$42
1998 1999 2000 2001
Net Sales
*Excludes restructuring program costs.
NET EARNINGS PER SHARE
(on a diluted basis)
1999
Net Earnings Per Share
0
2
$4
2000 2001
Core Net Earnings Per Share*