Proctor and Gamble 2001 Annual Report Download - page 36
Download and view the complete annual report
Please find page 36 of the 2001 Proctor and Gamble annual report below. You can navigate through the pages in the report by either clicking on the pages listed below, or by using the keyword search tool below to find specific information within the annual report.-
 1
1 -
2
-
3
-
4
-
5
-
6
-
7
-
8
-
9
-
10
-
11
-
12
-
13
-
14
-
15
-
16
-
17
-
18
-
19
-
20
-
21
-
22
-
23
-
24
-
25
-
 26
26 -
 27
27 -
 28
28 -
 29
29 -
 30
30 -
 31
31 -
 32
32 -
 33
33 -
 34
34 -
 35
35 -
 36
36 -
 37
37 -
 38
38 -
 39
39 -
 40
40
 |
 |

The Procter & Gamble Company and Subsidiaries
34
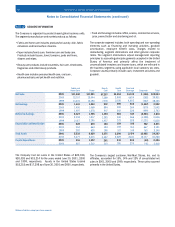
Notes to Consolidated Financial Statements (continued)
Millions of dollars except per share amounts
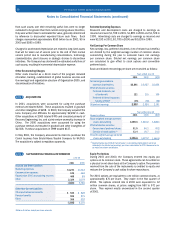
The Company’s largest customer, Wal-Mart Stores, Inc. and its
affiliates, accounted for 15%, 14% and 12% of consolidated net
sales in 2001, 2000 and 1999, respectively. These sales occurred
primarily in the United States.
The Company had net sales in the United States of $20,334,
$20,038 and $18,314 for the years ended June 30, 2001, 2000
and 1999, respectively. Assets in the United States totaled
$18,318 and $17,398 as of June 30, 2001 and 2000, respectively.
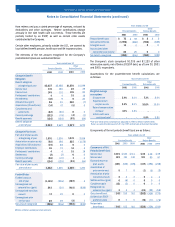
•Food and beverage includes coffee, snacks, commercial services,
juice, peanut butter and shortening and oil.
The corporate segment includes both operating and non-operating
elements such as financing and investing activities, goodwill
amortization, employee benefit costs, charges related to
restructuring, segment eliminations and other general corporate
items. The segment eliminations adjust management reporting
principles to accounting principles generally accepted in the United
States of America and primarily affect the treatment of
unconsolidated investees and income taxes, which are reflected in
the business segments using applicable local statutory tax rates.
Corporate assets primarily include cash, investment securities and
goodwill.
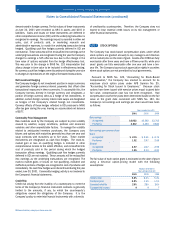
NOTE 12 SEGMENT INFORMATION
The Company is organized by product-based global business units.
The segments manufacture and market products as follows:
•Fabric and home care includes products for laundry, dish, fabric
enhancers and hard surface cleaners.
•Paper includes family care, feminine care and baby care.
Products include tissues, towel, tampons, pads and liners,
diapers and wipes.
•Beauty care products include cosmetics, hair care, deodorants,
fragrances and other beauty products.
•Health care includes personal health care, oral care,
pharmaceuticals and pet health and nutrition.
$39,244
39,951
38,125
2,922
3,542
3,763
4,616
5,536
5,838
2,271
2,191
2,148
34,387
34,366
2,486
3,018
Net Sales
Net Earnings
Before-Tax Earnings
Depreciation and Amortization
Total Assets
Capital Expenditures
2001
2000
1999
2001
2000
1999
2001
2000
1999
2001
2000
1999
2001
2000
2001
2000
$11,660
12,157
11,415
1,641
1,450
1,497
2,427
2,318
2,417
328
354
293
5,533
5,477
516
807
$11,991
12,044
12,190
1,043
1,069
1,278
1,735
1,817
2,195
673
664
638
8,629
8,415
1,307
1,512
$7,257
7,389
7,376
972
894
917
1,404
1,393
1,457
183
194
198
3,371
3,497
261
310
$4,353
3,909
2,876
390
335
242
584
540
372
159
159
107
2,290
2,229
231
195
$4,139
4,634
4,655
333
364
328
547
566
528
146
153
149
2,479
2,611
235
235
Corporate
$ 156
182
387
1,457
570
499
2,081
1,098
1,131
782
667
763
12,085
12,137
64
41
Total
Fabric and
Home Care Paper
Beauty
Care
Health
Care
Food and
Beverage
( )
( )
( )
( )
( )
( )
( )
( )
( )
( )
( )