Proctor and Gamble 2001 Annual Report Download - page 33
Download and view the complete annual report
Please find page 33 of the 2001 Proctor and Gamble annual report below. You can navigate through the pages in the report by either clicking on the pages listed below, or by using the keyword search tool below to find specific information within the annual report.-
 1
1 -
2
-
3
-
4
-
5
-
6
-
7
-
8
-
9
-
10
-
11
-
12
-
13
-
14
-
15
-
16
-
17
-
18
-
19
-
20
-
21
-
22
-
 23
23 -
 24
24 -
 25
25 -
 26
26 -
 27
27 -
 28
28 -
 29
29 -
 30
30 -
 31
31 -
 32
32 -
 33
33 -
 34
34 -
 35
35 -
 36
36 -
 37
37 -
 38
38 -
 39
39 -
 40
40
 |
 |

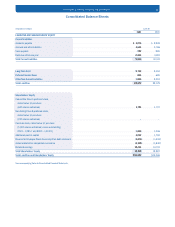
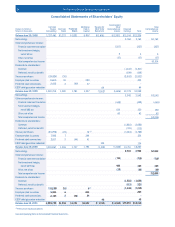
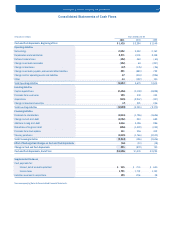
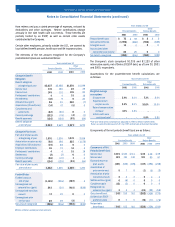
Millions of dollars except per share amounts
2001 2000 1999
Shares in Thousands
Outstanding, June 30
Series A
Series B
55,925
37,085
54,220
36,605
58,342
37,485
$279
18
297
2001 2000 1999
Years ended June 30
ESOP preferred shares allocated
at market value
Company contributions
Benefits earned
$313
1
314
$ 63
272
335
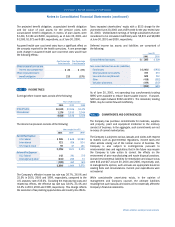
Company. The shares are convertible at the option of the holder into
one share of the Company’s common stock. Annual credits to
participants’ accounts are based on individual base salaries and
years of service, and do not exceed 15% of total participants’
annual salaries and wages. The liquidation value is equal to the
issue price of $13.75 per share.
In 1991, the ESOP borrowed an additional $1,000, also guaranteed
by the Company. The proceeds were used to purchase Series B
ESOP Convertible Class A Preferred Stock to fund a portion of
retiree health care benefits. Debt service requirements are $94 per
year, funded by preferred stock dividends and cash contributions
from the Company. Each share is convertible at the option of the
holder into one share of the Company’s common stock. The
liquidation value is equal to the issue price of $26.12 per share.
Shares of the ESOP are allocated at original cost based on debt
service requirements, net of advances made by the Company to the
trust. Dividends on all preferred shares, net of related tax benefit,
are charged to retained earnings. The preferred shares held by the
ESOP are considered outstanding from inception for purposes of
calculating diluted net earnings per common share.
The fair value of the Series A shares serves to reduce the
Company’s cash contribution required to fund the profit sharing
plan contributions earned. In 2001, allocated shares declined,
primarily due to changes in debt service requirements; this
impacted the Company’s cash contribution. The Series B shares
are considered plan assets of the other retiree benefits plan.
NOTE 9 POSTRETIREMENT BENEFITS
The Company offers various postretirement benefits to its employees.
Defined Contribution Retirement Plans
Within the U.S., the most significant retirement benefit is the defined
contribution profit sharing plan described in Note 8.
Other Retiree Benefits
The Company also provides certain health care and life insurance
benefits for substantially all U.S. employees who become eligible for
these benefits when they meet minimum age and service
requirements. Generally, the health care plans require contributions
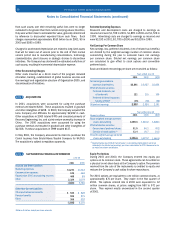
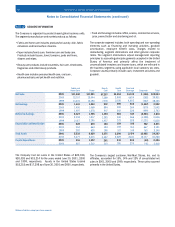
Stock option activity was as follows:
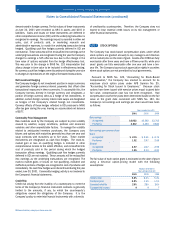
The following table summarizes information about stock options
outstanding at June 30, 2001:
The following table summarizes information about stock options
exercisable at June 30, 2001:
NOTE 8 EMPLOYEE STOCK OWNERSHIP PLAN
The Company maintains The Procter & Gamble Profit Sharing Trust
and Employee Stock Ownership Plan (ESOP) to provide funding for
two primary postretirement benefits: a defined contribution profit
sharing plan and certain U.S. postretirement health care benefits.
The ESOP borrowed $1,000 in 1989, which has been guaranteed
by the Company. The proceeds were used to purchase Series A
ESOP Convertible Class A Preferred Stock to fund a portion of the
defined contribution plan. Principal and interest requirements are
$117 per year, paid by the trust from dividends on the preferred
shares and from cash contributions and advances from the
Notes to Consolidated Financial Statements (continued)
The Procter & Gamble Company and Subsidiaries
Number
Outstanding
(Thousands)
Weighted Avg.
Remaining
Contractual Life
25 to 30
33 to 46
55 to 76
82 to 107
14,507
14,505
38,675
36,509
$ 26.66
37.91
62.11
90.17
1.8 years
4.3
12.0
10.0
Weighted Avg.
Exercise Price
Options Outstanding
$
Range of prices
$26.66
37.91
61.61
84.89
Options Exercisable
Number
Exercisable
(Thousands)
Weighted Avg.
Exercise Price
25 to 30
33 to 46
55 to 76
82 to 107
14,507
14,505
9,394
10,399
$
Range of prices
31
Outstanding, July 1
Granted
Exercised
Canceled
Outstanding, June 30
Exercisable
Available for grant
Average price:
Outstanding, beginning of year
Granted
Exercised
Outstanding, end of year
Exercisable, end of year
Weighted average fair value of options
granted during the year
Options in Thousands
2001 2000 1999
76,810
14,360
7,401
1,025
82,744
54,667
41,387
82,744
28,400
5,709
1,239
104,196
48,805
27,994
( )
( )
79,918
7,026
9,397
737
76,810
61,664
39,874
( )
( )
( )
( )
$61.73
62.20
24.77
63.64
49.14
22.45
$52.11
96.10
25.21
61.73
46.67
37.21
$45.58
89.72
22.36
52.11
43.79
32.23