Proctor and Gamble 2001 Annual Report Download - page 3
Download and view the complete annual report
Please find page 3 of the 2001 Proctor and Gamble annual report below. You can navigate through the pages in the report by either clicking on the pages listed below, or by using the keyword search tool below to find specific information within the annual report.-
 1
1 -
 2
2 -
 3
3 -
 4
4 -
 5
5 -
 6
6 -
 7
7 -
 8
8 -
 9
9 -
 10
10 -
 11
11 -
 12
12 -
 13
13 -
 14
14 -
15
-
16
-
17
-
18
-
19
-
20
-
21
-
22
-
23
-
24
-
25
-
26
-
27
-
28
-
29
-
30
-
31
-
32
-
33
-
34
-
35
-
36
-
37
-
38
-
39
-
40
 |
 |

When we began the 2000/2001 fiscal year, Job One was getting
P&G’s business back on track and growing again.
We have refocused on our biggest, and fastest growing brands, in
our biggest markets, with our leading customers. We’ve strengthened
the value of our brands for consumers. We’ve made strategic choices
about which businesses P&G should be in, and which it should not.
And we’ve improved P&G’s competitiveness by controlling costs and
managing cash more effectively. We believe these are the choices that
will deliver superior Total Shareholder Return, which is the key measure
of our progress and our underlying commitment to P&G shareholders.
Making Progress
We’ve made progress, although there’s more to do.
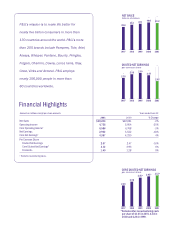
• Sales were $39.2 billion, down slightly from last year but
up 2% excluding the effects of unfavorable exchange rates.
• Net earnings were $2.9 billion. Core net earnings, which exclude
restructuring charges, were $4.4 billion – up 4% -- while earnings
per share were $3.12, up 6%.
• Business trends improved during the year. Fourth quarter unit
volumes grew 3% and we made significant progress on costs,
delivering core operating income growth of 12%.
• Operating cash flow increased over $1 billion.
Progress in the U.S. – our largest market – is particularly encouraging.
A year ago, only three of our top 10 U.S. brands were growing
share; at the end of the 2000/2001 fiscal year, eight of 10 were
growing share.
This progress isn’t limited to the U.S.
• In Latin America, 3% volume growth drove earnings
to record levels.
• Profits rebounded in China during the year and market
shares are now growing broadly.
• Elsewhere in Asia, we grew volume in virtually every country; in
the Philippines, for example, our Fabric and Home Care business
turned in an exceptional year with record volume and profits
while regaining volume-share leadership for the past six months.
• In Central and Eastern Europe, Russia
bounced back from the 1998 economic and
currency crises: volume, sales and market
shares are all rebounding with solid profits.
While we are pleased with this progress, we know
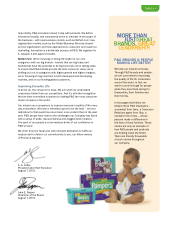
we still have a lot of hard work ahead of us. Diapers
and Feminine Protection – both of which are core,
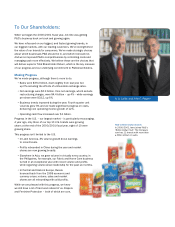
To Our Shareholders:
A. G. Lafley and John E. Pepper
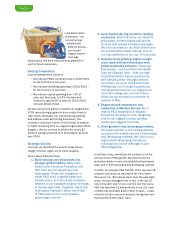
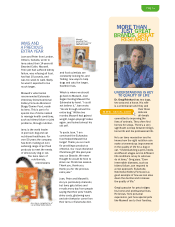
P&G’s Billion Dollar Brands
In 2000/2001, Iams joined P&G’s
“Billion Dollar Club.” The Company
now has 11 brands with more than
a billion dollars in sales.