Proctor and Gamble 2001 Annual Report Download - page 14
Download and view the complete annual report
Please find page 14 of the 2001 Proctor and Gamble annual report below. You can navigate through the pages in the report by either clicking on the pages listed below, or by using the keyword search tool below to find specific information within the annual report.-
 1
1 -
2
-
3
-
 4
4 -
 5
5 -
 6
6 -
 7
7 -
 8
8 -
 9
9 -
 10
10 -
 11
11 -
 12
12 -
 13
13 -
 14
14 -
 15
15 -
 16
16 -
 17
17 -
 18
18 -
 19
19 -
 20
20 -
 21
21 -
 22
22 -
 23
23 -
 24
24 -
25
-
26
-
27
-
28
-
29
-
30
-
31
-
32
-
33
-
34
-
35
-
36
-
37
-
38
-
39
-
40
 |
 |
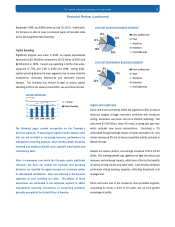
The Company maintains a share repurchase program, which
authorizes the purchase of shares annually on the open market to
mitigate the dilutive impact of employee compensation programs.
The Company also has a discretionary buy-back program under
which it may repurchase additional outstanding shares. Current year
purchases under the combined programs were $1.25 billion,
compared to $1.77 billion in 2000 and $2.53 billion in 1999. The
Company issued equity put options in 2001 for one million shares at
approximately $74 per share and for 12 million shares at prices
ranging from $60 to $71 per share in 2000, which reduce the
Company’s cash outlay for share repurchases.
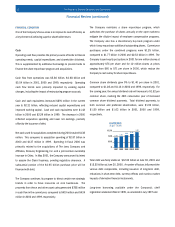
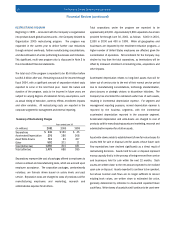
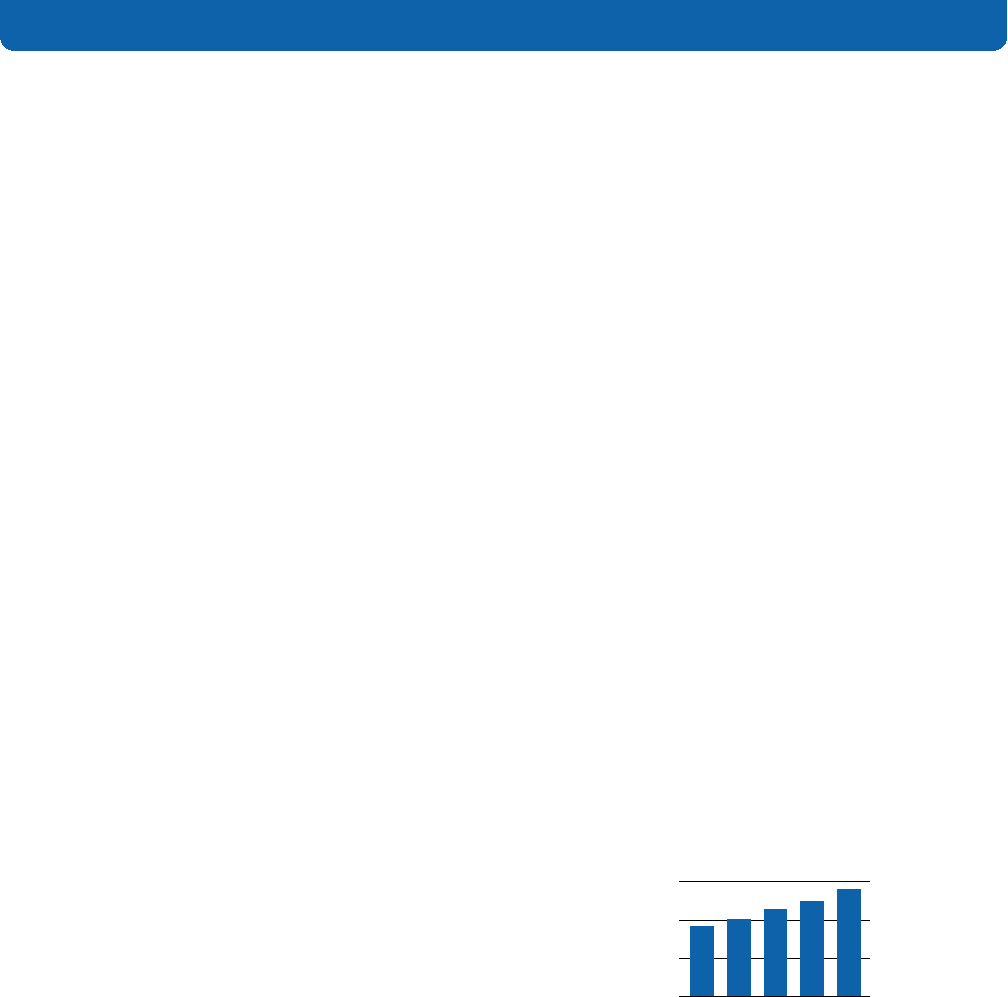
Common share dividends grew 9% to $1.40 per share in 2001,
compared to $1.28 and $1.14 in 2000 and 1999, respectively. For
the coming year, the annual dividend rate will increase to $1.52 per
common share, marking the 46th consecutive year of increased
common share dividend payments. Total dividend payments, to
both common and preferred shareholders, were $1.94 billion,
$1.80 billion and $1.63 billion in 2001, 2000 and 1999,
respectively.
Total debt was fairly stable at $12.03 billion at June 30, 2001 and
$12.25 billion at June 30, 2000. A number of factors influenced the
various debt components, including issuance of long-term debt,
reductions in short-term debt, currency effects and mark-to-market
impacts of derivative financial instruments.
Long-term borrowing available under the Company’s shelf
registration statement filed in 1995, as amended in July 1997 and
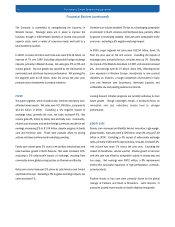
FINANCIAL CONDITION
One of the Company’s focus areas is to improve its cash efficiency as
a key element of achieving superior shareholder return.
Cash
Operating cash flow provides the primary source of funds to finance
operating needs, capital expenditures and shareholder dividends.
This is supplemented by additional borrowings to provide funds to
finance the share repurchase program and acquisitions.
Cash flow from operations was $5.80 billion, $4.68 billion and
$5.54 billion in 2001, 2000 and 1999, respectively. Operating
cash flow trends were primarily impacted by working capital
changes, including the impact of restructuring program accruals.
Cash and cash equivalents increased $891 million in the current
year to $2.31 billion, reflecting reduced capital expenditures and
improved working capital. Cash and cash equivalents were $1.42
billion in 2000 and $2.29 billion in 1999. The decrease in 2000
reflected acquisition spending and lower net earnings, partially
offset by the issuance of debt.
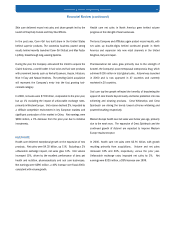
Net cash used for acquisitions completed during 2001 totaled $138
million. This compares to acquisition spending of $2.97 billion in
2000 and $137 million in 1999. Spending in fiscal 2000 was
primarily related to the acquisitions of The Iams Company and
Affiliates, Recovery Engineering, Inc. and a joint venture ownership
increase in China. In May 2001, the Company announced its intent
to acquire the Clairol business, pending regulatory clearance. A
substantial portion of the $4.95 billion purchase price will be
financed with debt.
The Company continues its program to divest certain non-strategic
brands in order to focus resources on core businesses. The
proceeds from these and other asset sales generated $788 million
in cash flow in the current year, compared to $419 million and $434
million in 2000 and 1999, respectively.
The Procter & Gamble Company and Subsidiaries
12
Financial Review (continued)
DIVIDENDS
($ per share)
1997
0
1998 1999 2000 2001
0.90 1.01 1.14 1.28
1.40
0.50
1.00
$1.50