Proctor and Gamble 2000 Annual Report Download - page 40
Download and view the complete annual report
Please find page 40 of the 2000 Proctor and Gamble annual report below. You can navigate through the pages in the report by either clicking on the pages listed below, or by using the keyword search tool below to find specific information within the annual report.-
 1
1 -
2
-
3
-
4
-
5
-
6
-
7
-
8
-
9
-
10
-
11
-
12
-
13
-
14
-
15
-
16
-
17
-
18
-
19
-
20
-
21
-
22
-
23
-
24
-
25
-
26
-
27
-
28
-
29
-
 30
30 -
 31
31 -
 32
32 -
 33
33 -
 34
34 -
 35
35 -
 36
36 -
 37
37 -
 38
38 -
 39
39 -
 40
40 -
 41
41 -
 42
42 -
 43
43 -
 44
44
 |
 |

The Procter & Gamble Company and Subsidiaries
38
Millions of dollars except per share amounts
NOTES TO CONSOLIDATED FINANCIAL STATEMENTS (CONTINUED)
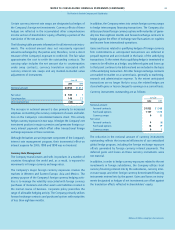
The Company had net sales in the United States of $20,038,
$18,314 and $17,848 for the years ended June 30, 2000, 1999 and
1998, respectively. Assets in the United States totaled $17,227
and $15,142 as of June 30, 2000 and 1999, respectively.
The Company’s largest customer, Wal-Mart Stores, Inc. and its
affiliates, accounted for 14%, 12% and 11% of consolidated net
sales in 2000, 1999 and 1998, respectively. These sales occurred
primarily in the United States.
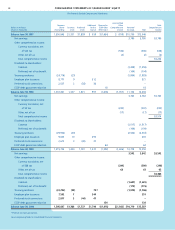
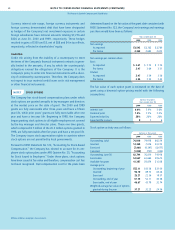
Fabric and Beauty Health Food and
Home Care Paper Care Care Beverage Corporate Total
Net Sales 2000 $12,157 $12,044 $7,389 $3,909 $4,634 $(182) $39,951
1999 11,415 12,190 7,376 2,876 4,655 (387) 38,125
1998 11,019 11,685 7,469 2,889 4,620 (528) 37,154
Net Earnings 2000 1,450 1,069 894 335 364 (570) 3,542
1999 1,497 1,278 917 242 328 (499) 3,763
1998 1,406 990 845 232 294 13 3,780
Before-Tax Earnings 2000 2,318 1,817 1,393 540 566 (1,098) 5,536
1999 2,417 2,195 1,457 372 528 (1,131) 5,838
1998 2,240 1,772 1,379 381 477 (541) 5,708
Depreciation and Amortization 2000 354 664 194 159 153 667 2,191
1999 293 638 198 107 149 763 2,148
1998 295 611 198 105 135 254 1,598
Total Assets 2000 5,477 8,415 3,497 2,229 2,611 11,965 34,194
1999 5,047 8,184 3,754 1,556 2,598 10,974 32,113
Capital Expenditures 2000 807 1,282 310 195 235 189 3,018
1999 638 1,327 285 143 237 198 2,828
NOTE 12 SEGMENT INFORMATION
On July 1, 1999, as part of the Organization 2005 initiative, the
Company changed its internal management structure to product-
based global business units. Previously, the Company had been
organized on a geographic basis. The segments manufacture and
market products as follows:
• Fabric and home care includes laundry care, dish care, fabric
conditioners and hard surface cleaners.
• Paper aggregates tissues and towel, feminine care and baby
care, which contains diapers and wipes.
• Beauty care includes cosmetics, hair care, deodorants, fragrances
and other beauty products.
• Health care includes personal health care, oral care, prescription
drugs and pet health and nutrition.
• Food and beverage includes coffee, snacks, commercial services,
juice, peanut butter and shortening and oil.
The Corporate segment includes both operating and non-operating
elements such as financing and investing activities, goodwill amorti-
zation, employee benefit costs, charges related to restructuring
(including the Organization 2005 program), segment eliminations
and other general corporate items. The segment eliminations adjust
management reporting principles to accounting principles generally
accepted in the United States of America and primarily affect the
treatment of unconsolidated investees and income taxes, which are
reflected in the business segments using applicable local statutory tax
rates. Corporate assets primarily include cash, investment securities
and goodwill.