Proctor and Gamble 2000 Annual Report Download - page 28
Download and view the complete annual report
Please find page 28 of the 2000 Proctor and Gamble annual report below. You can navigate through the pages in the report by either clicking on the pages listed below, or by using the keyword search tool below to find specific information within the annual report.-
 1
1 -
2
-
3
-
4
-
5
-
6
-
7
-
8
-
9
-
10
-
11
-
12
-
13
-
14
-
15
-
16
-
17
-
 18
18 -
 19
19 -
 20
20 -
 21
21 -
 22
22 -
 23
23 -
 24
24 -
 25
25 -
 26
26 -
 27
27 -
 28
28 -
 29
29 -
 30
30 -
 31
31 -
 32
32 -
 33
33 -
 34
34 -
 35
35 -
 36
36 -
 37
37 -
 38
38 -
39
-
40
-
41
-
42
-
43
-
44
 |
 |

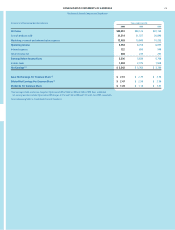
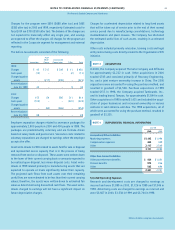
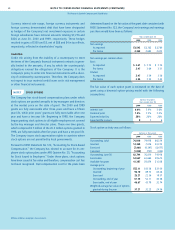
CONSOLIDATED BALANCE SHEETS
The Procter & Gamble Company and Subsidiaries
26
Amounts in millions June 30
2000 1999
ASSETS
Current Assets
Cash and cash equivalents $ 1,415 $ 2,294
Investment securities 185 506
Accounts receivable 2,910 2,940
Inventories
Materials and supplies 1,254 1,176
Work in process 394 375
Finished goods 1,842 1,787
Total Inventories 3,490 3,338
Deferred income taxes 309 621
Prepaid expenses and other current assets 1,760 1,659
Total Current Assets 10,069 11,358
Property, Plant and Equipment
Buildings 4,259 3,885
Machinery and equipment 18,366 16,953
Land 596 562
23,221 21,400
Accumulated depreciation (9,529) (8,774)
Total Property, Plant and Equipment 13,692 12,626
Goodwill and Other Intangible Assets
Goodwill 9,080 7,062
Trademarks and other intangible assets 1,305 1,115
10,385 8,177
Accumulated amortization (1,599) (1,355)
Total Goodwill and Other Intangible Assets 8,786 6,822
Other Non-Current Assets 1,647 1,307
Total Assets $34,194 $32,113
See accompanying Notes to Consolidated Financial Statements.