Proctor and Gamble 2000 Annual Report Download - page 27
Download and view the complete annual report
Please find page 27 of the 2000 Proctor and Gamble annual report below. You can navigate through the pages in the report by either clicking on the pages listed below, or by using the keyword search tool below to find specific information within the annual report.-
 1
1 -
2
-
3
-
4
-
5
-
6
-
7
-
8
-
9
-
10
-
11
-
12
-
13
-
14
-
15
-
16
-
 17
17 -
 18
18 -
 19
19 -
 20
20 -
 21
21 -
 22
22 -
 23
23 -
 24
24 -
 25
25 -
 26
26 -
 27
27 -
 28
28 -
 29
29 -
 30
30 -
 31
31 -
 32
32 -
 33
33 -
 34
34 -
 35
35 -
 36
36 -
 37
37 -
38
-
39
-
40
-
41
-
42
-
43
-
44
 |
 |

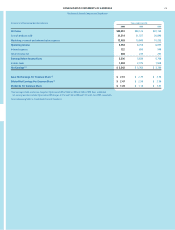
25CONSOLIDATED STATEMENTS OF EARNINGS
Amounts in millions except per share amounts Years ended June 30
2000 1999 1998
Net Sales $39,951 $38,125 $37,154
Cost of products sold 21,514 21,027 20,896
Marketing, research and administrative expense 12,483 10,845 10,203
Operating Income 5,954 6,253 6,055
Interest expense 722 650 548
Other income, net 304 235 201
Earnings Before Income Taxes 5,536 5,838 5,708
Income taxes 1,994 2,075 1,928
Net Earnings(1) $ 3,542 $ 3,763 $ 3,780
Basic Net Earnings Per Common Share(1) $ 2.61 $ 2.75 $ 2.74
Diluted Net Earnings Per Common Share(1) $ 2.47 $ 2.59 $ 2.56
Dividends Per Common Share $ 1.28 $ 1.14 $ 1.01
(1)Net earnings include an after-tax charge for Organization 2005 of $688 in 2000 and $385 in 1999. Basic and diluted
net earnings per share include Organization 2005 charges of $.52 and $.48 in 2000 and $.29 and $.26 in 1999, respectively.
See accompanying Notes to Consolidated Financial Statements.
The Procter & Gamble Company and Subsidiaries