Proctor and Gamble 2000 Annual Report Download - page 17
Download and view the complete annual report
Please find page 17 of the 2000 Proctor and Gamble annual report below. You can navigate through the pages in the report by either clicking on the pages listed below, or by using the keyword search tool below to find specific information within the annual report.-
 1
1 -
2
-
3
-
4
-
5
-
6
-
 7
7 -
 8
8 -
 9
9 -
 10
10 -
 11
11 -
 12
12 -
 13
13 -
 14
14 -
 15
15 -
 16
16 -
 17
17 -
 18
18 -
 19
19 -
 20
20 -
 21
21 -
 22
22 -
 23
23 -
 24
24 -
 25
25 -
 26
26 -
 27
27 -
28
-
29
-
30
-
31
-
32
-
33
-
34
-
35
-
36
-
37
-
38
-
39
-
40
-
41
-
42
-
43
-
44
 |
 |

FINANCIAL REVIEW (CONTINUED)
The Procter & Gamble Company and Subsidiaries
15
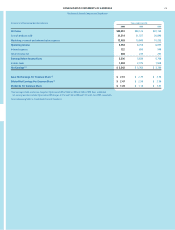
Cash and cash equivalents decreased $879 million in the
current year to $1.42 billion, reflecting acquisition spend-
ing and lower net earnings, partially offset by the issuance
of debt. In the prior year, cash and cash equivalents
increased by $745 million to $2.29 billion, reflecting
improved earnings, primarily concentrated in Europe.
Capital expenditures were $3.02 billion in 2000, $2.83 bil-
lion in 1999 and $2.56 billion in 1998. Current year
expenditures included initiatives and capacity increases
in fabric and home care and paper, including spending
on Organization 2005 projects. Capital expenditures
are expected to increase in the upcoming year, behind
the Organization 2005 program, including increased
capacity. In 1999, capital spending was driven by stan-
dardization projects in paper and capacity expansions in
the paper and food and beverage businesses.
Net cash used for acquisitions completed during 2000
totaled $2.97 billion, primarily related to the acquisitions
of The Iams Company and Affiliates, Recovery Engineering,
Inc. and a joint venture ownership increase in China. This
compares to acquisition spending of $137 million in 1999
and $3.27 billion in 1998. Transactions in fiscal 1998 were
largely concentrated in paper businesses and included
Tambrands, Inc., the Loreto y Peña paper company in
Mexico and the Ssangyong Paper Company in Korea. The
Company also increased ownership of various joint
ventures in Asia and Latin America in 1998.
The Company continues its program to divest certain
non-strategic brands in order to focus resources on core
businesses. The proceeds from these and other asset
sales generated $419 million in cash flow in the current
year, compared to $434 million and $555 million in 1999
and 1998, respectively.
The Company maintains a share repurchase program,
which authorizes the Company to purchase shares annu-
ally on the open market to mitigate the dilutive impact of
employee compensation programs. The Company also
has a discretionary buy-back program under which it
currently intends to repurchase additional outstanding
shares of up to $1 billion per year. Current year purchases
under the combined programs were $1.77 billion,
compared to $2.53 billion in 1999 and $1.93 billion in
1998. The Company issued equity put options in 2000 for
12 million shares at prices ranging from $60 to $71 per
share, which reduce the Company’s cash outlay for share
repurchases.
Common share dividends grew 12% to $1.28 per share in
2000, compared to $1.14 and $1.01 in 1999 and 1998,
respectively. For the coming year, the annual dividend
rate will increase to $1.40 per common share, marking the
45th consecutive year of increased common share divi-
dend payments. Total dividend payments, to both
common and preferred shareholders, were $1.80 billion,
$1.63 billion and $1.46 billion in 2000, 1999 and 1998,
respectively.
Total debt was up $2.75 billion to $12.13 billion, due to
the issuance of long-term debt to fund acquisitions and
share repurchases.
Long-term borrowing available under the Company’s shelf
registration statement filed in 1995, as amended in July
1997 and September 1999, was $1.87 billion at June 30,
2000. Additionally, the Company is able to issue com-
mercial paper at favorable rates and to access general
bank financing.