Proctor and Gamble 2000 Annual Report Download - page 34
Download and view the complete annual report
Please find page 34 of the 2000 Proctor and Gamble annual report below. You can navigate through the pages in the report by either clicking on the pages listed below, or by using the keyword search tool below to find specific information within the annual report.-
 1
1 -
2
-
3
-
4
-
5
-
6
-
7
-
8
-
9
-
10
-
11
-
12
-
13
-
14
-
15
-
16
-
17
-
18
-
19
-
20
-
21
-
22
-
23
-
 24
24 -
 25
25 -
 26
26 -
 27
27 -
 28
28 -
 29
29 -
 30
30 -
 31
31 -
 32
32 -
 33
33 -
 34
34 -
 35
35 -
 36
36 -
 37
37 -
 38
38 -
 39
39 -
 40
40 -
 41
41 -
 42
42 -
 43
43 -
 44
44
 |
 |

The Procter & Gamble Company and Subsidiaries
32
Millions of dollars except per share amounts
NOTES TO CONSOLIDATED FINANCIAL STATEMENTS (CONTINUED)
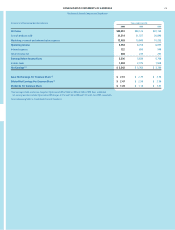
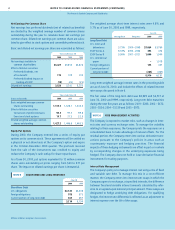
Net Earnings Per Common Share
Net earnings less preferred dividends (net of related tax benefits)
are divided by the weighted average number of common shares
outstanding during the year to calculate basic net earnings per
common share. Diluted net earnings per common share are calcu-
lated to give effect to stock options and convertible preferred stock.
Basic and diluted net earnings per share are reconciled as follows:
Years ended June 30
2000 1999 1998
Net earnings available to
common shareholders $3,427 $3,654 $3,676
Effect of dilutive securities
Preferred dividends, net
of tax benefit 115 109 104
Preferred dividend impact on
funding of ESOP (18) (22) (25)
Diluted net earnings 3,524 3,741 3,755
Years ended June 30
Shares in thousands 2000 1999 1998
Basic weighted average common
shares outstanding 1,313.2 1,328.1 1,343.4
Effect of dilutive securities
Conversion of preferred shares 94.3 97.2 99.8
Exercise of stock options 19.7 21.5 22.3
Diluted weighted average common
shares outstanding 1,427.2 1,446.8 1,465.5
Equity Put Options
During 2000, the Company entered into a series of equity put
options on its common stock. These agreements will be settled on
a physical or net-share basis at the Company’s option and expire
in the October-December 2000 quarter. The premium received
from the sale of the instruments was credited to equity and
reduces the Company’s cash outlay for share repurchases.
As of June 30, 2000, put options equivalent to 12 million common
shares were outstanding at prices ranging from $60 to $71 per
share. The impact on diluted earnings per share is immaterial.
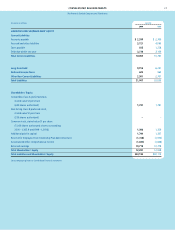
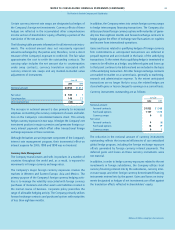
NOTE 5 SHORT-TERM AND LONG-TERM DEBT
June 30
2000 1999
Short-Term Debt
U.S. obligations $2,142 $2,308
Foreign obligations 785 375
Current portion of long-term debt 283 467
3,210 3,150
The weighted average short-term interest rates were 4.8% and
5.7% as of June 30, 2000 and 1999, respectively.
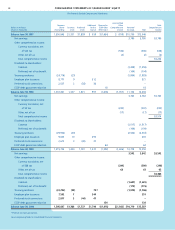
June 30
Average Rate Maturities 2000 1999
Long-Term Debt
U.S. notes and
debentures 5.73% 2000 – 2049 $7,664 $3,760
ESOP Series A 8.33% 2000 – 2004 392 472
ESOP Series B 9.36% 2007 – 2021 1,000 1,000
U.S. commercial
paper –1,019
Foreign obligations 143 447
Current portion of
long-term debt (283) (467)
8,916 6,231
Long-term weighted average interest rates in the preceding table
are as of June 30, 2000, and include the effects of related interest
rate swaps discussed in Note 6.
The fair value of the long-term debt was $8,929 and $6,517 at
June 30, 2000 and 1999, respectively. Long-term debt maturities
during the next five years are as follows: 2001– $283; 2002 – $472;
2003 – $534; 2004 – $1,139 and 2005 – $973.
NOTE 6 RISK MANAGEMENT ACTIVITIES
The Company is exposed to market risks, such as changes in inter-
est rates and currency exchange rates. To manage the volatility
relating to these exposures, the Company nets the exposures on a
consolidated basis to take advantage of natural offsets. For the
residual portion, the Company enters into various derivative trans-
actions pursuant to the Company’s policies in areas such as
counterparty exposure and hedging practices. The financial
impacts of these hedging instruments are offset in part or in whole
by corresponding changes in the underlying exposures being
hedged. The Company does not hold or issue derivative financial
instruments for trading purposes.
Interest Rate Management
The Company’s policy is to manage interest cost using a mix of fixed
and variable rate debt. To manage this mix in a cost-efficient
manner, the Company enters into interest rate swaps in which the
Company agrees to exchange, at specified intervals, the difference
between fixed and variable interest amounts calculated by refer-
ence to an agreed-upon notional principal amount. These swaps are
designated to hedge underlying debt obligations. For qualifying
hedges, the interest rate differential is reflected as an adjustment to
interest expense over the life of the swaps.