Proctor and Gamble 2000 Annual Report Download - page 38
Download and view the complete annual report
Please find page 38 of the 2000 Proctor and Gamble annual report below. You can navigate through the pages in the report by either clicking on the pages listed below, or by using the keyword search tool below to find specific information within the annual report.-
 1
1 -
2
-
3
-
4
-
5
-
6
-
7
-
8
-
9
-
10
-
11
-
12
-
13
-
14
-
15
-
16
-
17
-
18
-
19
-
20
-
21
-
22
-
23
-
24
-
25
-
26
-
27
-
 28
28 -
 29
29 -
 30
30 -
 31
31 -
 32
32 -
 33
33 -
 34
34 -
 35
35 -
 36
36 -
 37
37 -
 38
38 -
 39
39 -
 40
40 -
 41
41 -
 42
42 -
 43
43 -
 44
44
 |
 |

The Procter & Gamble Company and Subsidiaries
36
Millions of dollars except per share amounts
NOTES TO CONSOLIDATED FINANCIAL STATEMENTS (CONTINUED)
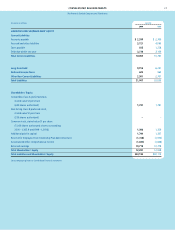
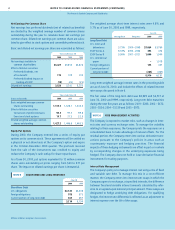
The elements of the net amount recognized for the Company’s
postretirement plans are summarized below:
Years ended June 30
Other
Pension Benefits Retiree Benefits
2000 1999 2000 1999
Change in Benefit
Obligation
Benefit obligation
at beginning of year $2,488 $2,282 $ 1,199 $ 1,465
Service cost 120 111 39 49
Interest cost 151 140 90 97
Participants’ contributions 4416 17
Amendments 9(5) 20 (1)
Actuarial loss (gain) 35 164 (7) (356)
Acquisitions 47 400
Curtailments and
settlements (20) (3) 00
Currency exchange (79) (73) (3) (1)
Benefit payments (128) (136) (84) (71)
Benefit obligation
at end of year 2,627 2,488 1,270 1,199
Change in Plan Assets
Fair value of plan assets
at beginning of year 1,555 1,523 2,516 2,611
Actual return on plan assets 198 111 (1,178) (49)
Acquisitions 28 400
Employer contributions 73 95 48
Participants’ contributions 4416 17
Settlements (2) 000
Currency exchange (37) (46) 00
Benefit payments (128) (136) (84) (71)
Fair value of plan assets
at end of year 1,691 1,555 1,274 2,516
Funded Status
Funded status at
end of year (936) (933) 41,317
Unrecognized net
actuarial loss (gain) (30) 17 (828) (2,384)
Unrecognized transition
amount 21 27 00
Unrecognized prior
service cost 39 37 1(21)
Net amount recognized (906) (852) (823) (1,088)
Prepaid benefit cost $59 $59 $2$1
Accrued benefit cost (990) (936) (825) (1,089)
Accumulated other
comprehensive income 25 25 00
Net liability recognized (906) (852) (823) (1,088)
The Company’s stock comprised $1,123 and $2,346 of other retiree
plan assets, net of Series B ESOP debt, as of June 30, 2000 and
1999, respectively.
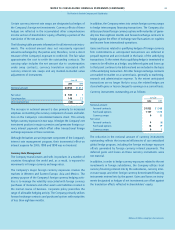
Assumptions for the postretirement benefit calculations are
as follows:
Years ended June 30
Other
Pension Benefits Retiree Benefits
2000 1999 2000 1999
Weighted average
assumptions
Discount rate 6.1% 6.0% 8.0% 7.5%
Expected return
on plan assets 8.1% 7.9% 10.0% 10.0%
Rate of compensation
increase 4.5% 4.6% ––
Initial health care
cost trend rate* ––5.8% 6.0%
*Assumed to decrease to 5.0% by 2006 and remain at that level thereafter.
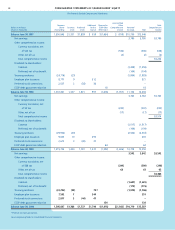
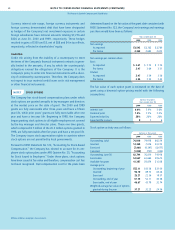
Components of the net periodic benefit cost are as follows:
Years ended June 30
Other
Pension Benefits Retiree Benefits
2000 1999 1998 2000 1999 1998
Components of Net
Periodic Benefit Cost
Service cost $ 120 $ 111 $ 106 $39$49$42
Interest cost 151 140 148 90 97 102
Expected return on
plan assets (122) (105) (103) (294) (218) (171)
Amortization of
prior service cost 787 (2) (2) (2)
Amortization of
transition amount 433 000
Settlement (gain) (6) 00 000
Curtailment loss (gain) (3) 012 000
Recognized net
actuarial loss (gain) 440 (92) (58) (41)
Gross benefit cost 155 161 173 (259) (132) (70)
Dividends on ESOP
preferred stock 000 (77) (78) (78)
Net periodic
benefit cost 155 161 173 (336) (210) (148)