Proctor and Gamble 2000 Annual Report Download - page 18
Download and view the complete annual report
Please find page 18 of the 2000 Proctor and Gamble annual report below. You can navigate through the pages in the report by either clicking on the pages listed below, or by using the keyword search tool below to find specific information within the annual report.-
 1
1 -
2
-
3
-
4
-
5
-
6
-
7
-
 8
8 -
 9
9 -
 10
10 -
 11
11 -
 12
12 -
 13
13 -
 14
14 -
 15
15 -
 16
16 -
 17
17 -
 18
18 -
 19
19 -
 20
20 -
 21
21 -
 22
22 -
 23
23 -
 24
24 -
 25
25 -
 26
26 -
 27
27 -
 28
28 -
29
-
30
-
31
-
32
-
33
-
34
-
35
-
36
-
37
-
38
-
39
-
40
-
41
-
42
-
43
-
44
 |
 |

FINANCIAL REVIEW (CONTINUED)
The Procter & Gamble Company and Subsidiaries
16
The following pages provide perspective on the
Company’s business segments. The Company moved to
a global product-based structure from a geographic struc-
ture effective July 1, 1999, and prior years’ results have
been restated for the change. Product-based segment
results exclude items that are not included in measuring
business performance for management reporting
purposes, most notably certain financing, investing
and employee benefit costs, goodwill amortization and
costs related to the Organization 2005 program.
Sales in companies over which the Company exerts
significant influence, but does not control the financial
and operating decisions, are reported for segment
purposes in a manner similar to consolidated sub-
sidiaries. Taxes are reflected in the businesses at local
statutory tax rates. The effects of these conventions
are eliminated in the Corporate segment to reconcile to
accounting principles generally accepted in the United
States of America.
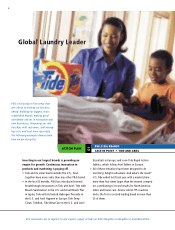
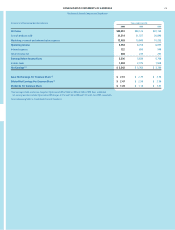
FABRIC AND HOME CARE
Net sales for fabric and home care were $12.16 billion,
an increase of 7% over the prior year. Unit volume grew
5%. Excluding foreign exchange impacts, primarily in
Western Europe, sales grew 9%. Net earnings for the
segment were $1.45 billion, down 3% versus year ago.
Fabric and home care represents the Company’s largest
business segment, accounting for nearly one third of
sales and an even greater percentage of earnings.
Strong sales growth was spurred by the introduction
of new brands and solid base business performance
in North America and Northeast Asia, as well as contin-
ued expansion within the Southern Cone (Brazil, Chile,
Argentina) of Latin America. Despite volume and sales
progress, earnings were down, primarily due to signifi-
cant investments in product initiatives.
Strong unit volume and sales growth was achieved in
North America versus the prior year. Several new brand
initiatives were launched, including Swiffer, Dryel and
Mr. Clean Wipes, along with product upgrades on estab-
lished brands, such as Tide. New business sales accounted
for approximately half of the growth.
Western Europe posted slight volume increases behind
the introductions of Swiffer and Dryel, as well as the
expansion of laundry tablets. Sales declined as pricing
lagged unfavorable exchange trends. Progress in Central
and Eastern Europe was strong following last year’s
economic crisis in Russia and reflecting an improved
cost structure.
Northeast Asia delivered high double-digit growth on
volume and sales, despite a challenging economic
environment. Strength on Ariel and Joy, as well as the
introduction of Febreze in Japan and South Korea, drove
the increases.
In 1999, net sales increased 4% over 1998, on flat unit
volume. Net earnings were $1.50 billion, a 6% increase.
North America was a strong contributor to segment
results, driving both sales and earnings gains.