Proctor and Gamble 2000 Annual Report Download - page 2
Download and view the complete annual report
Please find page 2 of the 2000 Proctor and Gamble annual report below. You can navigate through the pages in the report by either clicking on the pages listed below, or by using the keyword search tool below to find specific information within the annual report.-
 1
1 -
 2
2 -
 3
3 -
 4
4 -
 5
5 -
 6
6 -
 7
7 -
 8
8 -
 9
9 -
 10
10 -
 11
11 -
 12
12 -
 13
13 -
14
-
15
-
16
-
17
-
18
-
19
-
20
-
21
-
22
-
23
-
24
-
25
-
26
-
27
-
28
-
29
-
30
-
31
-
32
-
33
-
34
-
35
-
36
-
37
-
38
-
39
-
40
-
41
-
42
-
43
-
44
 |
 |

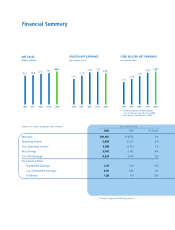
Financial Summary
2000 1999 % change
Net Sales $39,951 $38,125 5%
Operating Income 5,954 6,253 -5%
Core Operating Income†6,768 6,734 1%
Net Earnings 3,542 3,763 -6%
Core Net Earnings†4,230 4,148 2%
Per Common Share
Diluted Net Earnings 2.47 2.59 -5%
Core Diluted Net Earnings†2.95 2.85 4%
Dividends 1.28 1.14 12 %
Amounts in millions except per share amounts
NET SALES
billions of dollars
DILUTED NET EARNINGS
per common share
CORE DILUTED NET EARNINGS
per common share
1996 1997 1998 1999 2000
35.3 35.8 37.2 38.1 40.0
1996 1997 1998 1999 2000
2.01
2.28
2.56 2.59 2.47
1996 1997 1998 1999 2000
2.01
2.28
2.56
2.85* 2.95*
†Excludes Organization 2005 program costs.
* Excluding Organization 2005 program
costs of $.48 per share after tax in 2000
and $.26 per share after tax in 1999.
Years ended June 30