Pfizer 2013 Annual Report Download - page 97
Download and view the complete annual report
Please find page 97 of the 2013 Pfizer annual report below. You can navigate through the pages in the report by either clicking on the pages listed below, or by using the keyword search tool below to find specific information within the annual report.-
 1
1 -
2
-
3
-
4
-
5
-
6
-
7
-
8
-
9
-
10
-
11
-
12
-
13
-
14
-
15
-
16
-
17
-
18
-
19
-
20
-
21
-
22
-
23
-
24
-
25
-
26
-
27
-
28
-
29
-
30
-
31
-
32
-
33
-
34
-
35
-
36
-
37
-
38
-
39
-
40
-
41
-
42
-
43
-
44
-
45
-
46
-
47
-
48
-
49
-
50
-
51
-
52
-
53
-
54
-
55
-
56
-
57
-
58
-
59
-
60
-
61
-
62
-
63
-
64
-
65
-
66
-
67
-
68
-
69
-
70
-
71
-
72
-
73
-
74
-
75
-
76
-
77
-
78
-
79
-
80
-
81
-
82
-
83
-
84
-
85
-
86
-
 87
87 -
 88
88 -
 89
89 -
 90
90 -
 91
91 -
 92
92 -
 93
93 -
 94
94 -
 95
95 -
 96
96 -
 97
97 -
 98
98 -
 99
99 -
 100
100 -
 101
101 -
 102
102 -
 103
103 -
 104
104 -
 105
105 -
 106
106 -
 107
107 -
108
-
109
-
110
-
111
-
112
-
113
-
114
-
115
-
116
-
117
-
118
-
119
-
120
-
121
-
122
-
123
 |
 |

Notes to Consolidated Financial Statements
Pfizer Inc. and Subsidiary Companies
96
2013 Financial Report
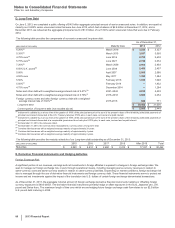
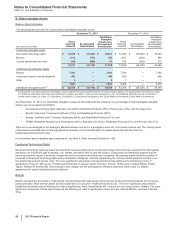
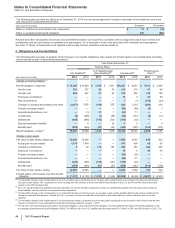
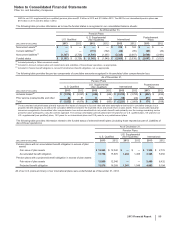
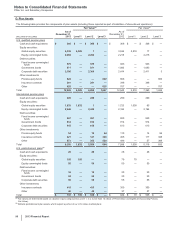
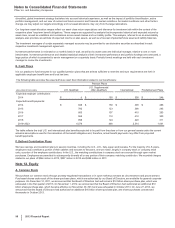
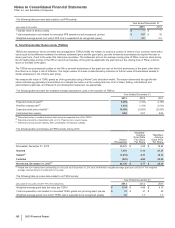
D. Plan Assets
The following table provides the components of plan assets (including those reported as part of Liabilities of discontinued operations):
Fair Value(a) Fair Value(a)
(MILLIONS OF DOLLARS)
As of
December 31,
2013 Level 1 Level 2 Level 3
As of
December 31,
2012 Level 1 Level 2 Level 3
U.S. qualified pension plans
Cash and cash equivalents $ 360 $ —$ 360 $ — $368 $—$
368 $—
Equity securities:
Global equity securities 4,335 4,328 7— 3,536 3,519 17 —
Equity commingled funds 2,294 — 2,294 — 2,215 —2,215 —
Debt securities:
Fixed income commingled
funds 675 —675 — 943 —943 —
Government bonds 971 —971 — 1,093 —1,093 —
Corporate debt securities 2,306 — 2,306 — 2,414 —2,411 3
Other investments:
Private equity funds 822 —— 822 866 ——
866
Insurance contracts 281 —281 — 348 —348 —
Other 825 —— 825 757 ——
757
Total 12,869 4,328 6,894 1,647 12,540 3,519 7,395 1,626
International pension plans
Cash and cash equivalents 229 —229 — 299 —299 —
Equity securities:
Global equity securities 1,833 1,832 1— 1,723 1,638 85 —
Equity commingled funds 2,446 — 2,446 — 2,194 —2,194 —
Debt securities:
Fixed income commingled
funds 967 —967 — 825 —825 —
Government bonds 812 —812 — 914 —914 —
Corporate debt securities 615 —615 — 613 —613 —
Other investments:
Private equity funds 54 —10 44 110 —1496
Insurance contracts 421 —121 300 465 —117 348
Other 873 —353 520 446 —57
389
Total 8,250 1,832 5,554 864 7,589 1,638 5,118 833
U.S. postretirement plans(b)
Cash and cash equivalents 29 —29 — 28 — 28 —
Equity securities:
Global equity securities 105 105 — — 79 79 — —
Equity commingled funds 56 —56 — 50 — 50 —
Debt securities:
Fixed income commingled
funds 16 —16 — 20 — 20 —
Government bonds 24 —24 — 25 — 25 —
Corporate debt securities 56 —56 — 55 — 55 —
Other investments:
Insurance contracts 415 —415 — 350 —350 —
Other 40 —40 — 37 — 37 —
Total $ 741 $ 105 $ 636 $ — $644 $79$
565 $—
(a) Fair values are determined based on valuation inputs categorized as Level 1, 2 or 3 (see Note 1E. Basis of Presentation and Significant Accounting Policies:
Fair Value).
(b) Reflects postretirement plan assets, which support a portion of our U.S. retiree medical plans.