Pfizer 2013 Annual Report Download - page 84
Download and view the complete annual report
Please find page 84 of the 2013 Pfizer annual report below. You can navigate through the pages in the report by either clicking on the pages listed below, or by using the keyword search tool below to find specific information within the annual report.-
 1
1 -
2
-
3
-
4
-
5
-
6
-
7
-
8
-
9
-
10
-
11
-
12
-
13
-
14
-
15
-
16
-
17
-
18
-
19
-
20
-
21
-
22
-
23
-
24
-
25
-
26
-
27
-
28
-
29
-
30
-
31
-
32
-
33
-
34
-
35
-
36
-
37
-
38
-
39
-
40
-
41
-
42
-
43
-
44
-
45
-
46
-
47
-
48
-
49
-
50
-
51
-
52
-
53
-
54
-
55
-
56
-
57
-
58
-
59
-
60
-
61
-
62
-
63
-
64
-
65
-
66
-
67
-
68
-
69
-
70
-
71
-
72
-
73
-
 74
74 -
 75
75 -
 76
76 -
 77
77 -
 78
78 -
 79
79 -
 80
80 -
 81
81 -
 82
82 -
 83
83 -
 84
84 -
 85
85 -
 86
86 -
 87
87 -
 88
88 -
 89
89 -
 90
90 -
 91
91 -
 92
92 -
 93
93 -
 94
94 -
95
-
96
-
97
-
98
-
99
-
100
-
101
-
102
-
103
-
104
-
105
-
106
-
107
-
108
-
109
-
110
-
111
-
112
-
113
-
114
-
115
-
116
-
117
-
118
-
119
-
120
-
121
-
122
-
123
 |
 |

Notes to Consolidated Financial Statements
Pfizer Inc. and Subsidiary Companies
2013 Financial Report
83
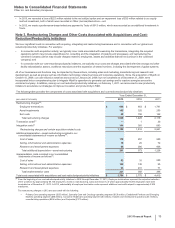
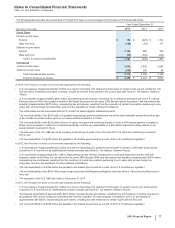
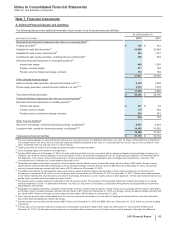
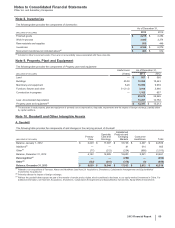
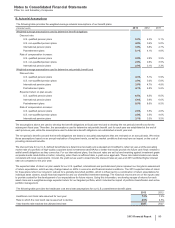
Note 7. Financial Instruments
A. Selected Financial Assets and Liabilities
The following table provides additional information about certain of our financial assets and liabilities:
As of December 31,
(MILLIONS OF DOLLARS) 2013 2012
Selected financial assets measured at fair value on a recurring basis(a)
Trading securities(b) $126 $142
Available-for-sale debt securities(c) 34,899 32,584
Available-for-sale money market funds(d) 945 1,727
Available-for-sale equity securities, excluding money market funds(c) 356 263
Derivative financial instruments in receivable positions(e):
Interest rate swaps 468 1,036
Foreign currency swaps 871 194
Foreign currency forward-exchange contracts 172 152
37,837 36,098
Other selected financial assets
Held-to-maturity debt securities, carried at amortized cost(c), (f) 9,139 1,459
Private equity securities, carried at equity method or at cost(f), (g) 2,270 1,239
11,409 2,698
Total selected financial assets $49,246 $38,796
Financial liabilities measured at fair value on a recurring basis(a)
Derivative financial instruments in a liability position(h):
Interest rate swaps $301 $33
Foreign currency swaps 110 428
Foreign currency forward-exchange contracts 219 243
630 704
Other financial liabilities(i)
Short-term borrowings, carried at historical proceeds, as adjusted(f) 6,027 6,424
Long-term debt, carried at historical proceeds, as adjusted(j), (k) 30,462 31,036
36,489 37,460
Total selected financial liabilities $37,119 $38,164
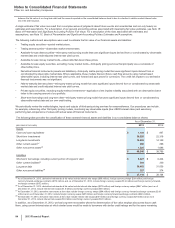
(a) We use a market approach in valuing financial instruments on a recurring basis. For additional information, see Note 1E. Basis of Presentation and Significant
Accounting Policies: Fair Value. All of our financial assets and liabilities measured at fair value on a recurring basis use Level 2 inputs in the calculation of fair
value, except less than 1% that use Level 1 or Level 3 inputs.
(b) Trading securities are held in trust for legacy business acquisition severance benefits.
(c) Gross unrealized gains and losses are not significant.
(d) Includes $408 million as of December 31, 2012 of money market funds held in trust in connection with the asbestos litigation involving Quigley Company, Inc.,
(Quigley), then a wholly owned subsidiary. In the fourth quarter of 2013, the amended reorganization plan for Quigley became effective. For information about
the disposition of the money market fund investment in connection with the amended reorganization plan for Quigley becoming effective, see Note 17A5.
Commitments and Contingencies: Certain Matters Resolved in 2013.
(e) Designated as hedging instruments, except for certain contracts used as offsets; namely, interest rate swaps with fair values of $38 million, foreign currency
swaps with fair values of $30 million and foreign currency forward-exchange contracts with fair values of $66 million as of December 31, 2013; and, foreign
currency forward-exchange contracts with fair values of $102 million as of December 31, 2012.
(f) The differences between the estimated fair values and carrying values of held-to-maturity debt securities, private equity securities at cost and short-term
borrowings not measured at fair value on a recurring basis were not significant as of December 31, 2013 or December 31, 2012. The fair value measurements
of our held-to-maturity debt securities and our short-term borrowings are based on Level 2 inputs, using a market approach. The fair value measurements of our
private equity securities at cost are based on Level 3 inputs.
(g) Our private equity securities represent investments in the life sciences sector. The increase in 2013 primarily reflects an increased investment in our equity-
method investment in China. For additional information, see Note 2D. Acquisitions, Divestitures, Collaborative Arrangements and Equity-Method Investments:
Equity-Method Investments.
(h) Designated as hedging instruments, except for certain foreign currency contracts used as offsets; namely, foreign currency swaps with fair values of $76 million
and foreign currency forward-exchange contracts with fair values of $77 million as of December 31, 2013; and foreign currency forward-exchange contracts with
fair values of $141 million and foreign currency swaps with fair values of $129 million as of December 31, 2012.
(i) Some carrying amounts may include adjustments for discount or premium amortization or for the effect of hedging the interest rate fair value risk associated
with certain financial liabilities by interest rate swaps.
(j) Includes foreign currency debt with fair values of $651 million as of December 31, 2013 and $809 million as of December 31, 2012, which are used as hedging
instruments.
(k) The fair value of our long-term debt (not including the current portion of long-term debt) is $35.1 billion as of December 31, 2013 and $37.5 billion as of
December 31, 2012. The fair value measurements for our long-term debt are based on Level 2 inputs, using a market approach. Generally, the difference