Pfizer 2013 Annual Report Download - page 43
Download and view the complete annual report
Please find page 43 of the 2013 Pfizer annual report below. You can navigate through the pages in the report by either clicking on the pages listed below, or by using the keyword search tool below to find specific information within the annual report.-
 1
1 -
2
-
3
-
4
-
5
-
6
-
7
-
8
-
9
-
10
-
11
-
12
-
13
-
14
-
15
-
16
-
17
-
18
-
19
-
20
-
21
-
22
-
23
-
24
-
25
-
26
-
27
-
28
-
29
-
30
-
31
-
32
-
 33
33 -
 34
34 -
 35
35 -
 36
36 -
 37
37 -
 38
38 -
 39
39 -
 40
40 -
 41
41 -
 42
42 -
 43
43 -
 44
44 -
 45
45 -
 46
46 -
 47
47 -
 48
48 -
 49
49 -
 50
50 -
 51
51 -
 52
52 -
 53
53 -
54
-
55
-
56
-
57
-
58
-
59
-
60
-
61
-
62
-
63
-
64
-
65
-
66
-
67
-
68
-
69
-
70
-
71
-
72
-
73
-
74
-
75
-
76
-
77
-
78
-
79
-
80
-
81
-
82
-
83
-
84
-
85
-
86
-
87
-
88
-
89
-
90
-
91
-
92
-
93
-
94
-
95
-
96
-
97
-
98
-
99
-
100
-
101
-
102
-
103
-
104
-
105
-
106
-
107
-
108
-
109
-
110
-
111
-
112
-
113
-
114
-
115
-
116
-
117
-
118
-
119
-
120
-
121
-
122
-
123
 |
 |

Financial Review
Pfizer Inc. and Subsidiary Companies
42
2013 Financial Report
• For Pension benefit obligations, net and Postretirement benefit obligations, net, the change also reflects, among other things, significant
reductions due to changes in the assumed discount rates used for measuring the obligations and favorable plan asset performance
during the year, for plans with assets. For additional information, see Notes to Consolidated Financial Statements—Note 11. Pension and
Postretirement Benefit Plans and Defined Contribution Plans.
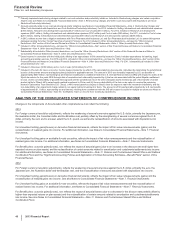
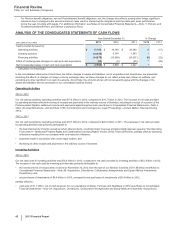
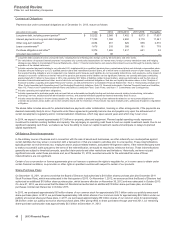
ANALYSIS OF THE CONSOLIDATED STATEMENTS OF CASH FLOWS
Year Ended December 31, % Change
(MILLIONS OF DOLLARS) 2013 2012 2011 13/12 12/11
Cash provided by/(used in):
Operating activities $17,765 $16,746 $20,240 6(17)
Investing activities (10,625) 6,154 1,843 **
Financing activities (14,975) (15,999) (20,607) (6) (22)
Effect of exchange-rate changes on cash and cash equivalents (63)(2) (29)*(93)
Net increase/(decrease) in Cash and cash equivalents $ (7,898) $6,899 $1,447 **
* Calculation not meaningful.
In the consolidated statements of cash flows, the Other changes in assets and liabilities, net of acquisitions and divestitures, are presented
excluding the effects of changes in foreign currency exchange rates, as these changes do not reflect actual cash inflows or outflows, and
excluding any other significant non-cash movements. Accordingly, the amounts shown will not necessarily agree with the changes in the
assets and liabilities that are presented in our consolidated balance sheets.
Operating Activities
2013 v. 2012
Our net cash provided by operating activities was $17.8 billion in 2013, compared to $16.7 billion in 2012. The increase in net cash provided
by operating activities reflects the timing of receipts and payments in the ordinary course of business, including the receipt of a portion of the
Protonix patent litigation settlement income and payments against legal accruals (see Notes to Consolidated Financial Statements—Note 4.
Other (Income)/Deductions—Net and Note 17A5. Commitments and Contingencies: Legal Proceedings—Certain Matters Resolved During
2013).
2012 v. 2011
Our net cash provided by operating activities was $16.7 billion in 2012, compared to $20.2 billion in 2011. The decrease in net cash provided
by operating activities was primarily attributable to:
• the loss of exclusivity of Lipitor, as well as certain other products, resulting in lower revenues and associated expenses (see also "Our Operating
Environment—Intellectual Property Rights and Collaboration/Licensing Rights" section of this Financial Review), partially offset by spending
reductions resulting from our company-wide cost-reduction initiatives;
• payments made in connection with certain legal matters; and
• the timing of other receipts and payments in the ordinary course of business.
Investing Activities
2013 v. 2012
Our net cash used in investing activities was $10.6 billion in 2013, compared to net cash provided by investing activities of $6.2 billion in 2012.
The increase in net cash used by investing activities was primarily attributable to:
• the nonrecurrence of net proceeds received on November 30, 2012 from the sale of our Nutrition business of $11.85 billion (see Notes to
Consolidated Financial Statements––Note 2B. Acquisitions, Divestitures, Collaborative Arrangements and Equity-Method Investments:
Divestitures); and
• net purchases of investments of $9.4 billion in 2013, compared to net purchases of investments of $3.4 billion in 2012,
partially offset by:
• cash paid of $1.1 billion, net of cash acquired, for our acquisitions of Alacer, Ferrosan and NextWave in 2012 (see Notes to Consolidated
Financial Statements––Note 2A. Acquisitions, Divestitures, Collaborative Arrangements and Equity-Method Investments: Acquisitions).