Pfizer 2013 Annual Report Download - page 94
Download and view the complete annual report
Please find page 94 of the 2013 Pfizer annual report below. You can navigate through the pages in the report by either clicking on the pages listed below, or by using the keyword search tool below to find specific information within the annual report.-
 1
1 -
2
-
3
-
4
-
5
-
6
-
7
-
8
-
9
-
10
-
11
-
12
-
13
-
14
-
15
-
16
-
17
-
18
-
19
-
20
-
21
-
22
-
23
-
24
-
25
-
26
-
27
-
28
-
29
-
30
-
31
-
32
-
33
-
34
-
35
-
36
-
37
-
38
-
39
-
40
-
41
-
42
-
43
-
44
-
45
-
46
-
47
-
48
-
49
-
50
-
51
-
52
-
53
-
54
-
55
-
56
-
57
-
58
-
59
-
60
-
61
-
62
-
63
-
64
-
65
-
66
-
67
-
68
-
69
-
70
-
71
-
72
-
73
-
74
-
75
-
76
-
77
-
78
-
79
-
80
-
81
-
82
-
83
-
 84
84 -
 85
85 -
 86
86 -
 87
87 -
 88
88 -
 89
89 -
 90
90 -
 91
91 -
 92
92 -
 93
93 -
 94
94 -
 95
95 -
 96
96 -
 97
97 -
 98
98 -
 99
99 -
 100
100 -
 101
101 -
 102
102 -
 103
103 -
 104
104 -
105
-
106
-
107
-
108
-
109
-
110
-
111
-
112
-
113
-
114
-
115
-
116
-
117
-
118
-
119
-
120
-
121
-
122
-
123
 |
 |

Notes to Consolidated Financial Statements
Pfizer Inc. and Subsidiary Companies
2013 Financial Report
93
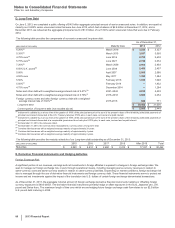
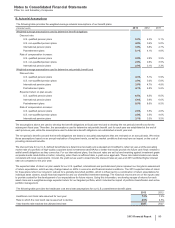
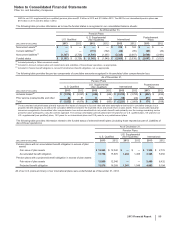
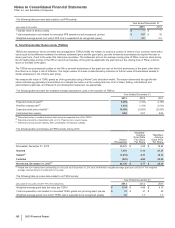
B. Actuarial Assumptions
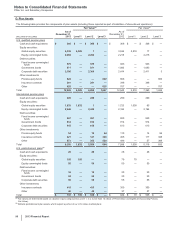
The following table provides the weighted-average actuarial assumptions of our benefit plans:
(PERCENTAGES) 2013 2012 2011
Weighted-average assumptions used to determine benefit obligations
Discount rate:
U.S. qualified pension plans 5.2% 4.3% 5.1%
U.S. non-qualified pension plans 4.8% 3.9% 5.0%
International pension plans 3.9% 3.8% 4.7%
Postretirement plans 5.1% 4.1% 4.8%
Rate of compensation increase:
U.S. qualified pension plans 2.8% 2.8% 3.5%
U.S. non-qualified pension plans 2.8% 2.8% 3.5%
International pension plans 2.9% 3.1% 3.3%
Weighted-average assumptions used to determine net periodic benefit cost
Discount rate:
U.S. qualified pension plans 4.3% 5.1% 5.9%
U.S. non-qualified pension plans 3.9% 5.0% 5.8%
International pension plans 3.8% 4.7% 4.8%
Postretirement plans 4.1% 4.8% 5.6%
Expected return on plan assets:
U.S. qualified pension plans 8.5% 8.5% 8.5%
International pension plans 5.6% 5.9% 6.0%
Postretirement plans 8.5% 8.5% 8.5%
Rate of compensation increase:
U.S. qualified pension plans 2.8% 3.5% 4.0%
U.S. non-qualified pension plans 2.8% 3.5% 4.0%
International pension plans 3.1% 3.3% 3.5%
The assumptions above are used to develop the benefit obligations at fiscal year-end and to develop the net periodic benefit cost for the
subsequent fiscal year. Therefore, the assumptions used to determine net periodic benefit cost for each year are established at the end of
each previous year, while the assumptions used to determine benefit obligations are established at each year-end.
The net periodic benefit cost and the benefit obligations are based on actuarial assumptions that are reviewed on an annual basis. We revise
these assumptions based on an annual evaluation of long-term trends, as well as market conditions that may have an impact on the cost of
providing retirement benefits.
The discount rate for our U.S. defined benefit plans is determined annually and evaluated and modified to reflect at year-end the prevailing
market rate of a portfolio of high-quality corporate bond investments rated AA/Aa or better that would provide the future cash flows needed to
settle benefit obligations as they come due. For our international plans, the discount rates are set by benchmarking against investment grade
corporate bonds rated AA/Aa or better, including, when there is sufficient data, a yield curve approach. These rate determinations are made
consistent with local requirements. Overall, the yield curves used to determine the discount rates at year-end 2013 exhibited higher interest
rates as compared to the prior year.
The expected rates of return on plan assets for our U.S. qualified, international and postretirement plans represent our long-term assessment
of return expectations, which we may change based on shifts in economic and financial market conditions. The 2013 expected rates of return
for these plans reflect our long-term outlook for a globally diversified portfolio, which is influenced by a combination of return expectations for
individual asset classes, actual historical experience and our diversified investment strategy. The historical returns are one of the inputs used
to provide context for the development of our expectations for future returns. Using this information, we develop ranges of returns for each
asset class and a weighted-average expected return for our targeted portfolio, which includes the impact of portfolio diversification and active
portfolio management.
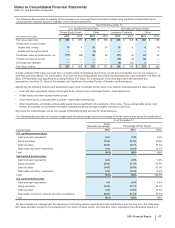
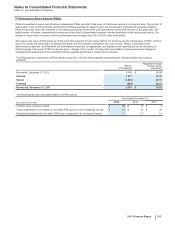
The following table provides the healthcare cost trend rate assumptions for our U.S. postretirement benefit plans:
2013 2012
Healthcare cost trend rate assumed for next year 7.3% 7.5%
Rate to which the cost trend rate is assumed to decline 4.5% 4.5%
Year that the rate reaches the ultimate trend rate 2027 2027