Pfizer 2013 Annual Report Download - page 90
Download and view the complete annual report
Please find page 90 of the 2013 Pfizer annual report below. You can navigate through the pages in the report by either clicking on the pages listed below, or by using the keyword search tool below to find specific information within the annual report.-
 1
1 -
2
-
3
-
4
-
5
-
6
-
7
-
8
-
9
-
10
-
11
-
12
-
13
-
14
-
15
-
16
-
17
-
18
-
19
-
20
-
21
-
22
-
23
-
24
-
25
-
26
-
27
-
28
-
29
-
30
-
31
-
32
-
33
-
34
-
35
-
36
-
37
-
38
-
39
-
40
-
41
-
42
-
43
-
44
-
45
-
46
-
47
-
48
-
49
-
50
-
51
-
52
-
53
-
54
-
55
-
56
-
57
-
58
-
59
-
60
-
61
-
62
-
63
-
64
-
65
-
66
-
67
-
68
-
69
-
70
-
71
-
72
-
73
-
74
-
75
-
76
-
77
-
78
-
79
-
 80
80 -
 81
81 -
 82
82 -
 83
83 -
 84
84 -
 85
85 -
 86
86 -
 87
87 -
 88
88 -
 89
89 -
 90
90 -
 91
91 -
 92
92 -
 93
93 -
 94
94 -
 95
95 -
 96
96 -
 97
97 -
 98
98 -
 99
99 -
 100
100 -
101
-
102
-
103
-
104
-
105
-
106
-
107
-
108
-
109
-
110
-
111
-
112
-
113
-
114
-
115
-
116
-
117
-
118
-
119
-
120
-
121
-
122
-
123
 |
 |

Notes to Consolidated Financial Statements
Pfizer Inc. and Subsidiary Companies
2013 Financial Report
89
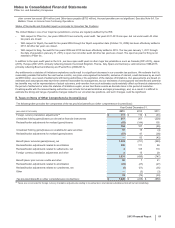
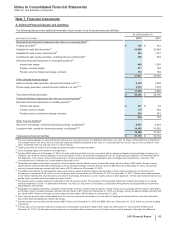
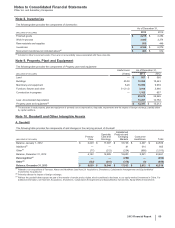
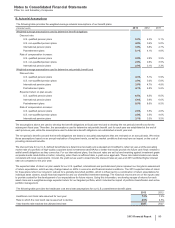
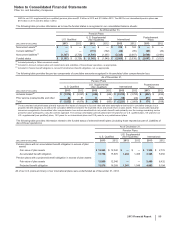
Note 8. Inventories
The following table provides the components of Inventories:
As of December 31,
(MILLIONS OF DOLLARS) 2013 2012
Finished goods $2,216 $2,254
Work-in-process 3,445 3,374
Raw materials and supplies 505 448
Inventories $6,166 $6,076
Noncurrent inventories not included above(a) $463 $612
(a) Included in Other noncurrent assets. There are no recoverability issues associated with these amounts.
Note 9. Property, Plant and Equipment
The following table provides the components of Property, plant and equipment:
Useful Lives As of December 31,
(MILLIONS OF DOLLARS) (Years) 2013 2012
Land —$557 $566
Buildings 33-50 10,055 10,643
Machinery and equipment 8-20 10,050 9,939
Furniture, fixtures and other 3-12 1/2 3,914 3,860
Construction in progress —1,102 957
25,678 25,965
Less: Accumulated depreciation 13,281 12,752
Property, plant and equipment(a) $12,397 $13,213
(a) The decrease in total property, plant and equipment is primarily due to depreciation, disposals, impairments and the impact of foreign exchange, partially offset
by capital additions.
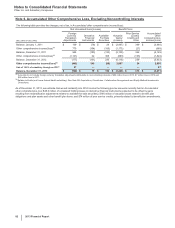
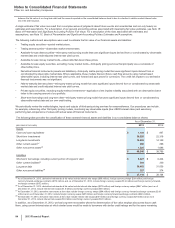
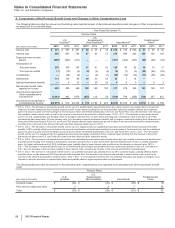
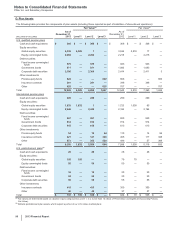
Note 10. Goodwill and Other Intangible Assets
A. Goodwill
The following table provides the components of and changes in the carrying amount of Goodwill:
(MILLIONS OF DOLLARS)
Primary
Care
Specialty
Care and
Oncology
Established
Products and
Emerging
Markets
Consumer
Healthcare Total
Balance, January 1, 2012 $ 6,229 $17,097 $18,746 $2,497 $44,569
Additions(a) ——91
514 605
Other(b) (77)(212)(234)(990)(1,513)
Balance, December 31, 2012 6,152 16,885 18,603 2,021 43,661
Derecognition(c) ——
(292)—
(292)
Other(b) (122)(341)(378)(9)
(850)
Balance, December 31, 2013 $ 6,030 $16,544 $17,933 $2,012 $42,519
(a) Related to our acquisitions of Ferrosan, Alacer and NextWave (see Note 2A. Acquisitions, Divestitures, Collaborative Arrangements and Equity-Method
Investments: Acquisitions).
(b) Primarily reflects the impact of foreign exchange.
(c) Reflects the goodwill derecognized as part of the transfer of certain product rights, which constituted a business, to our equity-method investment in China. For
additional information, see Note 2D. Acquisitions, Divestitures, Collaborative Arrangements and Equity-Method Investments: Equity-Method Investments.