Pfizer 2013 Annual Report Download - page 95
Download and view the complete annual report
Please find page 95 of the 2013 Pfizer annual report below. You can navigate through the pages in the report by either clicking on the pages listed below, or by using the keyword search tool below to find specific information within the annual report.-
 1
1 -
2
-
3
-
4
-
5
-
6
-
7
-
8
-
9
-
10
-
11
-
12
-
13
-
14
-
15
-
16
-
17
-
18
-
19
-
20
-
21
-
22
-
23
-
24
-
25
-
26
-
27
-
28
-
29
-
30
-
31
-
32
-
33
-
34
-
35
-
36
-
37
-
38
-
39
-
40
-
41
-
42
-
43
-
44
-
45
-
46
-
47
-
48
-
49
-
50
-
51
-
52
-
53
-
54
-
55
-
56
-
57
-
58
-
59
-
60
-
61
-
62
-
63
-
64
-
65
-
66
-
67
-
68
-
69
-
70
-
71
-
72
-
73
-
74
-
75
-
76
-
77
-
78
-
79
-
80
-
81
-
82
-
83
-
84
-
 85
85 -
 86
86 -
 87
87 -
 88
88 -
 89
89 -
 90
90 -
 91
91 -
 92
92 -
 93
93 -
 94
94 -
 95
95 -
 96
96 -
 97
97 -
 98
98 -
 99
99 -
 100
100 -
 101
101 -
 102
102 -
 103
103 -
 104
104 -
 105
105 -
106
-
107
-
108
-
109
-
110
-
111
-
112
-
113
-
114
-
115
-
116
-
117
-
118
-
119
-
120
-
121
-
122
-
123
 |
 |

Notes to Consolidated Financial Statements
Pfizer Inc. and Subsidiary Companies
94
2013 Financial Report
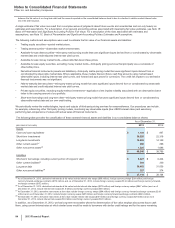
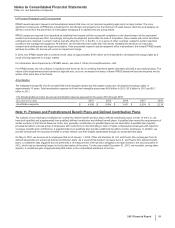
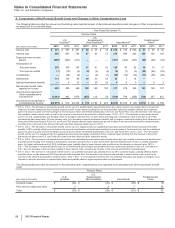
The following table provides the effects as of December 31, 2013 of a one-percentage-point increase or decrease in the healthcare cost trend
rate assumed for postretirement benefits:
(MILLIONS OF DOLLARS) Increase Decrease
Effect on total service and interest cost components $15$
(14)
Effect on postretirement benefit obligation 248 (222)
Actuarial and other assumptions for pension and postretirement plans can result from a complex series of judgments about future events and
uncertainties and can rely heavily on estimates and assumptions. For a description of the risks associated with estimates and assumptions,
see Note 1C. Basis of Presentation and Significant Accounting Policies: Estimates and Assumptions.
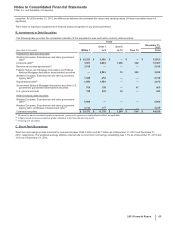
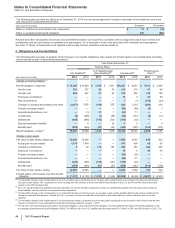
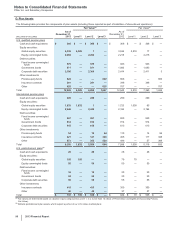
C. Obligations and Funded Status
The following table provides an analysis of the changes in our benefit obligations, plan assets and funded status of our benefit plans (including
those reported as part of discontinued operations):
Year Ended December 31,
Pension Plans
U.S. Qualified(a) U.S. Supplemental
(Non-Qualified)(b) International(c) Postretirement
Plans(d)
(MILLIONS OF DOLLARS) 2013 2012 2013 2012 2013 2012 2013 2012
Change in benefit obligation (e)
Benefit obligation, beginning $ 16,268 $14,835 $ 1,549 $1,431 $10,227 $ 8,891 $ 4,165 $ 3,900
Service cost 301 357 26 35 216 215 61 68
Interest cost 666 697 67 62 378 406 166 182
Employee contributions ————10 969 58
Plan amendments ————1(1) (152) (24)
Changes in actuarial assumptions and other (2,257) 1,926 (165) 252 229 1,232 (540) 259
Foreign exchange impact ————(66) (80) (9) 1
Acquisitions/divestitures, net —(1)37 1(63) 71 ——
Curtailments (8)(605)(1) (80)(64) (101) (8) (11)
Settlements (444)(485)(105) (121)(156) (33) ——
Special termination benefits —8—30 45—6
Benefits paid (550)(464)(67) (61)(400) (387) (314) (274)
Benefit obligation, ending(e) 13,976 16,268 1,341 1,549 10,316 10,227 3,438 4,165
Change in plan assets
Fair value of plan assets, beginning 12,540 12,005 ——7,589 6,953 644 422
Actual gain on plan assets 1,318 1,464 ——976 668 98 85
Company contributions 520 172 182 380 383 244 353
Employee contributions ————10 969 58
Foreign exchange impact ————(95) (35) ——
Acquisitions/divestitures, net ————(54) 31 ——
Settlements (444)(485)(105) (121)(156) (33) ——
Benefits paid (550)(464)(67) (61)(400) (387) (314) (274)
Fair value of plan assets, ending 12,869 12,540 ——8,250 7,589 741 644
Funded status—Plan assets less than benefit
obligation $ (1,107) $ (3,728) $ (1,341) $ (1,549) $(2,066) $ (2,638) $ (2,697) $ (3,521)
(a) The favorable change in the funded status of our U.S. qualified plans is primarily due to the plan gains resulting from the increase in the discount rate and an
increase in plan assets. The curtailments in 2012 resulting from the decision to freeze the defined benefit plans in the U.S. and Puerto Rico had a favorable
impact on the 2012 funded status.
(b) Our U.S. supplemental (non-qualified) plans are generally not funded and these obligations, which are substantially greater than the annual cash outlay for
these liabilities, will be paid from cash generated from operations.
(c) The favorable change in the funded status of our international plans is primarily due to an increase in plan assets partially offset by plan losses resulting from
changes in actuarial assumptions. Outside the U.S., in general, we fund our defined benefit plans to the extent that tax or other incentives exist or the law
requires.
(d) The favorable change in the funded status of our postretirement plans is primarily due to the plan gains resulting from the increase in the discount rate and the
impact of a decision to move participants to Medicare Advantage effective January 1, 2015.
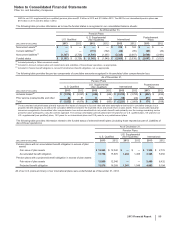
(e) For the U.S. and international pension plans, the benefit obligation is the projected benefit obligation. For the postretirement plans, the benefit obligation is the
accumulated postretirement benefit obligation (ABO). The ABO for all of our U.S. qualified pension plans was $13.7 billion in 2013 and $15.9 billion in 2012. The