Pfizer 2013 Annual Report Download - page 20
Download and view the complete annual report
Please find page 20 of the 2013 Pfizer annual report below. You can navigate through the pages in the report by either clicking on the pages listed below, or by using the keyword search tool below to find specific information within the annual report.-
 1
1 -
2
-
3
-
4
-
5
-
6
-
7
-
8
-
9
-
 10
10 -
 11
11 -
 12
12 -
 13
13 -
 14
14 -
 15
15 -
 16
16 -
 17
17 -
 18
18 -
 19
19 -
 20
20 -
 21
21 -
 22
22 -
 23
23 -
 24
24 -
 25
25 -
 26
26 -
 27
27 -
 28
28 -
 29
29 -
 30
30 -
31
-
32
-
33
-
34
-
35
-
36
-
37
-
38
-
39
-
40
-
41
-
42
-
43
-
44
-
45
-
46
-
47
-
48
-
49
-
50
-
51
-
52
-
53
-
54
-
55
-
56
-
57
-
58
-
59
-
60
-
61
-
62
-
63
-
64
-
65
-
66
-
67
-
68
-
69
-
70
-
71
-
72
-
73
-
74
-
75
-
76
-
77
-
78
-
79
-
80
-
81
-
82
-
83
-
84
-
85
-
86
-
87
-
88
-
89
-
90
-
91
-
92
-
93
-
94
-
95
-
96
-
97
-
98
-
99
-
100
-
101
-
102
-
103
-
104
-
105
-
106
-
107
-
108
-
109
-
110
-
111
-
112
-
113
-
114
-
115
-
116
-
117
-
118
-
119
-
120
-
121
-
122
-
123
 |
 |

Financial Review
Pfizer Inc. and Subsidiary Companies
2013 Financial Report
19
The total rebates and chargebacks for 2013 decreased compared to 2012, primarily as a result of:
• the impact of decreased Medicaid rebates for certain products that have lost exclusivity;
• lower Medicaid utilization trends; and
• a decrease in sales chargebacks for certain products that have lost exclusivity,
partially offset by:
• an increase in Medicare rebates due to higher volume;
• an increase in chargebacks for our branded products as a result of increasing competitive pressures;
• an increase in performance-based contract rebates in a number of European markets and China as a result of competitive factors and
contract arrangements; and
• changes in product mix.
Our accruals for Medicaid rebates, Medicare rebates, performance-based contract rebates, sales allowances and chargebacks were $3.3
billion as of December 31, 2013 and $3.6 billion as of December 31, 2012, and primarily are included in Other current liabilities in our
consolidated balance sheets.
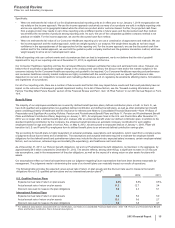
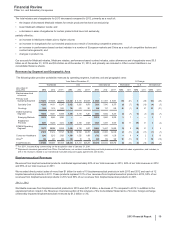
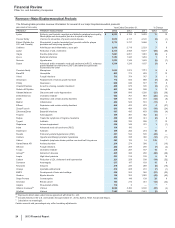
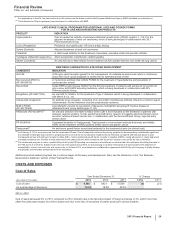
Revenues by Segment and Geographic Area
The following table provides worldwide revenues by operating segment, business unit and geographic area:
Year Ended December 31, % Change
Worldwide U.S. International Worldwide U.S. International
(MILLIONS OF
DOLLARS) 2013 2012 2011(a) 2013 2012 2011(a) 2013 2012 2011(a) 13/12 12/11 13/12 12/11 13/12 12/11
Biopharmaceutical
revenues:
Primary Care
Operating Segment $ 13,272 $ 15,558 $22,670 $ 8,352 $8,191 $12,819 $ 4,920 $ 7,367 $ 9,851 (15) (31) 2(36) (33) (25)
Specialty Care 13,288 14,151 15,245 5,652 6,206 6,870 7,636 7,945 8,375 (6) (7) (9) (10) (4) (5)
Oncology 1,646 1,310 1,323 738 573 391 908 737 932 26 (1) 29 47 23 (21)
SC&O Operating
Segment 14,934 15,461 16,568 6,390 6,779 7,261 8,544 8,682 9,307 (3) (7) (6) (7) (2) (7)
Emerging Markets 10,215 9,960 9,295 ———10,215 9,960 9,295 37——37
Established
Products 9,457 10,235 9,214 3,828 4,738 3,627 5,629 5,497 5,587 (8) 11 (19) 31 2(2)
EP&EM Operating
Segment 19,672 20,195 18,509 3,828 4,738 3,627 15,844 15,457 14,882 (3) 9(19) 31 34
47,878 51,214 57,747 18,570 19,708 23,707 29,308 31,506 34,040 (7) (11) (6) (17) (7) (7)
Consumer Healthcare 3,342 3,212 3,028 1,580 1,526 1,490 1,762 1,686 1,538 4642510
Other(b) 364 231 260 124 79 78 240 152 182 58 (11) 57 158 (16)
Total Revenues $ 51,584 $ 54,657 $61,035 $20,274 $ 21,313 $25,275 $31,310 $33,344 $35,760 (6) (10) (5) (16) (6) (7)
(a) For 2011, includes King commencing on the acquisition date of January 31, 2011.
(b) Represents revenues generated from Pfizer CentreSource, our contract manufacturing and bulk pharmaceutical chemical sales organization, and includes, in
2013, the revenues related to our transitional manufacturing and supply agreements with Zoetis.
Biopharmaceutical Revenues
Revenues from biopharmaceutical products contributed approximately 93% of our total revenues in 2013, 94% of our total revenues in 2012
and 95% of our total revenues in 2011.
We recorded direct product sales of more than $1 billion for each of 10 biopharmaceutical products in both 2013 and 2012 and each of 12
biopharmaceutical products in 2011. These products represent 51% of our revenues from biopharmaceutical products in 2013, 50% of our
revenues from biopharmaceutical products in 2012 and 56% of our revenues from biopharmaceutical products in 2011.
2013 v. 2012
Worldwide revenues from biopharmaceutical products in 2013 were $47.9 billion, a decrease of 7% compared to 2012. In addition to the
operational factors noted in the Revenues Overview section of this Analysis of the Consolidated Statements of Income, foreign exchange
unfavorably impacted biopharmaceutical revenues by $1.2 billion or 3%.