Pfizer 2013 Annual Report Download - page 15
Download and view the complete annual report
Please find page 15 of the 2013 Pfizer annual report below. You can navigate through the pages in the report by either clicking on the pages listed below, or by using the keyword search tool below to find specific information within the annual report.-
 1
1 -
2
-
3
-
4
-
 5
5 -
 6
6 -
 7
7 -
 8
8 -
 9
9 -
 10
10 -
 11
11 -
 12
12 -
 13
13 -
 14
14 -
 15
15 -
 16
16 -
 17
17 -
 18
18 -
 19
19 -
 20
20 -
 21
21 -
 22
22 -
 23
23 -
 24
24 -
 25
25 -
26
-
27
-
28
-
29
-
30
-
31
-
32
-
33
-
34
-
35
-
36
-
37
-
38
-
39
-
40
-
41
-
42
-
43
-
44
-
45
-
46
-
47
-
48
-
49
-
50
-
51
-
52
-
53
-
54
-
55
-
56
-
57
-
58
-
59
-
60
-
61
-
62
-
63
-
64
-
65
-
66
-
67
-
68
-
69
-
70
-
71
-
72
-
73
-
74
-
75
-
76
-
77
-
78
-
79
-
80
-
81
-
82
-
83
-
84
-
85
-
86
-
87
-
88
-
89
-
90
-
91
-
92
-
93
-
94
-
95
-
96
-
97
-
98
-
99
-
100
-
101
-
102
-
103
-
104
-
105
-
106
-
107
-
108
-
109
-
110
-
111
-
112
-
113
-
114
-
115
-
116
-
117
-
118
-
119
-
120
-
121
-
122
-
123
 |
 |

Financial Review
Pfizer Inc. and Subsidiary Companies
14
2013 Financial Report
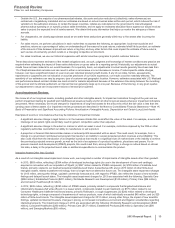
• In 2011, $834 million, the majority of which relates to intangible assets that were acquired as part of our acquisition of Wyeth. These
impairment charges reflect (i) $458 million of IPR&D assets, primarily related to two compounds for the treatment of certain autoimmune
and inflammatory diseases; (ii) $193 million related to our biopharmaceutical indefinite-lived brand, Xanax/Xanax XR; and (iii) $183
million related to developed technology rights comprising the impairment of five assets. The intangible asset impairment charges for 2011
reflect, among other things, the impact of new scientific findings and an increased competitive environment. The impairment charges in
2011 are associated with the following: Worldwide Research and Development ($394 million); Established Products ($193 million);
Specialty Care ($135 million); Primary Care ($56 million); and Oncology ($56 million).
For a description of our accounting policy, see Notes to Consolidated Financial Statements––Note 1K. Basis of Presentation and Significant
Accounting Policies: Amortization of Intangible Assets, Depreciation and Certain Long-Lived Assets.
When we are required to determine the fair value of intangible assets other than goodwill, we use an income approach, specifically the multi-
period excess earnings method, also known as the discounted cash flow method. We start with a forecast of all the expected net cash flows
associated with the asset, which includes the application of a terminal value for indefinite-lived assets, and then we apply an asset-specific
discount rate to arrive at a net present value amount. Some of the more significant estimates and assumptions inherent in this approach
include: the amount and timing of the projected net cash flows, which includes the expected impact of competitive, legal and/or regulatory
forces on the projections and the impact of technological risk associated with IPR&D assets, as well as the selection of a long-term growth
rate; the discount rate, which seeks to reflect the various risks inherent in the projected cash flows; and the tax rate, which seeks to
incorporate the geographic diversity of the projected cash flows.
While all intangible assets other than goodwill can face events and circumstances that can lead to impairment, in general, intangible assets
other than goodwill that are most at risk of impairment include IPR&D assets (approximately $443 million as of December 31, 2013) and newly
acquired or recently impaired indefinite-lived brand assets (approximately $1.5 billion as of December 31, 2013). IPR&D assets are high-risk
assets, as research and development is an inherently risky activity. Newly acquired and recently impaired indefinite-lived assets are more
vulnerable to impairment as the assets are recorded at fair value and are then subsequently measured at the lower of fair value or carrying
value at the end of each reporting period. As such, immediately after acquisition or impairment, even small declines in the outlook for these
assets can negatively impact our ability to recover the carrying value and can result in an impairment charge.
• One of our indefinite-lived biopharmaceutical brands, Xanax/Xanax XR, was written down to its fair value of $1.2 billion at the end of the
third quarter of 2013. This asset continues to be at risk for future impairment. Any negative change in the undiscounted cash flows,
discount rate and/or tax rate could result in an impairment charge. Xanax/Xanax XR, which was launched in the mid-1980s and acquired
in 2003, must continue to remain competitive against its generic challengers or the associated asset may become impaired again. We re-
considered and confirmed the classification of this asset as indefinite-lived at the time of the impairment. We will continue to closely
monitor this asset.
Goodwill
As a result of our goodwill impairment review work, we concluded that none of our goodwill is impaired as of December 31, 2013, and we do
not believe the risk of impairment is significant at this time.
For a description of our accounting policy, see Notes to Consolidated Financial Statements—Note 1K. Basis of Presentation and Significant
Accounting Policies: Amortization of Intangible Assets, Depreciation and Certain Long-Lived Assets.
When we are required to determine the fair value of a reporting unit, as appropriate for the individual reporting unit, we may use the market
approach, the income approach or a weighted-average combination of both approaches.
• The market approach is a historical approach to estimating fair value and relies primarily on external information. Within the market
approach are two methods that we may use:
Guideline public company method—this method employs market multiples derived from market prices of stocks of companies that
are engaged in the same or similar lines of business and that are actively traded on a free and open market and the application of
the identified multiples to the corresponding measure of our reporting unit’s financial performance.
Guideline transaction method—this method relies on pricing multiples derived from transactions of significant interests in companies
engaged in the same or similar lines of business and the application of the identified multiples to the corresponding measure of our
reporting unit’s financial performance.
The market approach is only appropriate when the available external information is robust and deemed to be a reliable proxy for the
specific reporting unit being valued; however, these assessments may prove to be incomplete or inaccurate. Some of the more significant
estimates and assumptions inherent in this approach include: the selection of appropriate guideline companies and transactions and the
determination of applicable premiums and discounts based on any differences in ownership percentages, ownership rights, business
ownership forms or marketability between the reporting unit and the guideline companies and transactions.
• The income approach is a forward-looking approach to estimating fair value and relies primarily on internal forecasts. Within the income
approach, the method that we use is the discounted cash flow method. We start with a forecast of all the expected net cash flows
associated with the reporting unit, which includes the application of a terminal value, and then we apply a reporting unit-specific discount
rate to arrive at a net present value amount. Some of the more significant estimates and assumptions inherent in this approach include:
the amount and timing of the projected net cash flows, which includes the expected impact of technological risk and competitive, legal
and/or regulatory forces on the projections, as well as the selection of a long-term growth rate; the discount rate, which seeks to reflect
the various risks inherent in the projected cash flows; and the tax rate, which seeks to incorporate the geographic diversity of the
projected cash flows.