Pfizer 2013 Annual Report Download - page 18
Download and view the complete annual report
Please find page 18 of the 2013 Pfizer annual report below. You can navigate through the pages in the report by either clicking on the pages listed below, or by using the keyword search tool below to find specific information within the annual report.-
 1
1 -
2
-
3
-
4
-
5
-
6
-
7
-
 8
8 -
 9
9 -
 10
10 -
 11
11 -
 12
12 -
 13
13 -
 14
14 -
 15
15 -
 16
16 -
 17
17 -
 18
18 -
 19
19 -
 20
20 -
 21
21 -
 22
22 -
 23
23 -
 24
24 -
 25
25 -
 26
26 -
 27
27 -
 28
28 -
29
-
30
-
31
-
32
-
33
-
34
-
35
-
36
-
37
-
38
-
39
-
40
-
41
-
42
-
43
-
44
-
45
-
46
-
47
-
48
-
49
-
50
-
51
-
52
-
53
-
54
-
55
-
56
-
57
-
58
-
59
-
60
-
61
-
62
-
63
-
64
-
65
-
66
-
67
-
68
-
69
-
70
-
71
-
72
-
73
-
74
-
75
-
76
-
77
-
78
-
79
-
80
-
81
-
82
-
83
-
84
-
85
-
86
-
87
-
88
-
89
-
90
-
91
-
92
-
93
-
94
-
95
-
96
-
97
-
98
-
99
-
100
-
101
-
102
-
103
-
104
-
105
-
106
-
107
-
108
-
109
-
110
-
111
-
112
-
113
-
114
-
115
-
116
-
117
-
118
-
119
-
120
-
121
-
122
-
123
 |
 |

Financial Review
Pfizer Inc. and Subsidiary Companies
2013 Financial Report
17
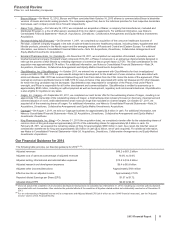
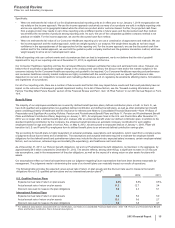
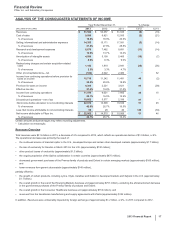
ANALYSIS OF THE CONSOLIDATED STATEMENTS OF INCOME
Year Ended December 31, % Change
(MILLIONS OF DOLLARS) 2013 2012 2011 13/12 12/11
Revenues $51,584 $ 54,657 $ 61,035 (6) (10)
Cost of sales 9,586 9,821 12,500 (2) (21)
% of revenues 18.6%18.0%20.5%
Selling, informational and administrative expenses 14,355 15,171 17,581 (5) (14)
% of revenues 27.8%27.8%28.8%
Research and development expenses 6,678 7,482 8,681 (11)(14)
% of revenues 12.9%13.7%14.2%
Amortization of intangible assets 4,599 5,109 5,465 (10)(7)
% of revenues 8.9% 9.3% 9.0%
Restructuring charges and certain acquisition-related
costs 1,182 1,810 2,841 (35)(36)
% of revenues 2.3% 3.3% 4.7%
Other (income)/deductions—net (532)4,022 2,486 *62
Income from continuing operations before provision for
taxes on income 15,716 11,242 11,481 40 (2)
% of revenues 30.5%20.6%18.8%
Provision for taxes on income 4,306 2,221 3,621 94 (39)
Effective tax rate 27.4%19.8%31.5%
Income from continuing operations 11,410 9,021 7,860 26 15
% of revenues 22.1%16.5%12.9%
Discontinued operations—net of tax 10,662 5,577 2,189 91 *
Net income before allocation to noncontrolling interests 22,072 14,598 10,049 51 45
% of revenues 42.8%26.7%16.5%
Less: Net income attributable to noncontrolling interests 69 28 40 146 (30)
Net income attributable to Pfizer Inc. $22,003 $ 14,570 $ 10,009 51 46
% of revenues 42.7%26.7%16.4%
Certain amounts and percentages may reflect rounding adjustments.
* Calculation not meaningful.
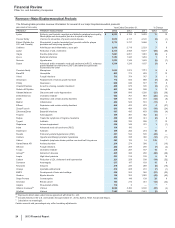
Revenues-Overview
Total revenues were $51.6 billion in 2013, a decrease of 6% compared to 2012, which reflects an operational decline of $1.9 billion, or 4%.
The operational decrease was primarily the result of:
• the continued erosion of branded Lipitor in the U.S., developed Europe and certain other developed markets (approximately $1.7 billion);
• the loss of exclusivity for Geodon in March 2012 in the U.S. (approximately $130 million);
• other product losses of exclusivity (approximately $1.3 billion);
• the ongoing expiration of the Spiriva collaboration in certain countries (approximately $475 million);
• decreased government purchases of the Prevnar family of products and Enbrel in certain emerging markets (approximately $160 million);
and
• lower revenues from generic atorvastatin (approximately $145 million),
partially offset by:
• the growth of certain products, including Lyrica, Inlyta, Celebrex and Xalkori in developed markets and Xeljanz in the U.S. (approximately
$1.1 billion);
• the overall growth in the rest of the Emerging Markets business unit (approximately $751 million), excluding the aforementioned decrease
in the government purchases of the Prevnar family of products and Enbrel;
• the overall growth in the Consumer Healthcare business unit (approximately $153 million); and
• revenues from the transitional manufacturing and supply agreements with Zoetis (approximately $132 million).
In addition, Revenues were unfavorably impacted by foreign exchange of approximately $1.2 billion, or 2%, in 2013 compared to 2012.